Swiss vs Cambodian In Labor Force | Age 16-19
COMPARE
Swiss
Cambodian
In Labor Force | Age 16-19
In Labor Force | Age 16-19 Comparison
Swiss
Cambodians
43.3%
IN LABOR FORCE | AGE 16-19
100.0/ 100
METRIC RATING
20th/ 347
METRIC RANK
37.0%
IN LABOR FORCE | AGE 16-19
71.5/ 100
METRIC RATING
161st/ 347
METRIC RANK
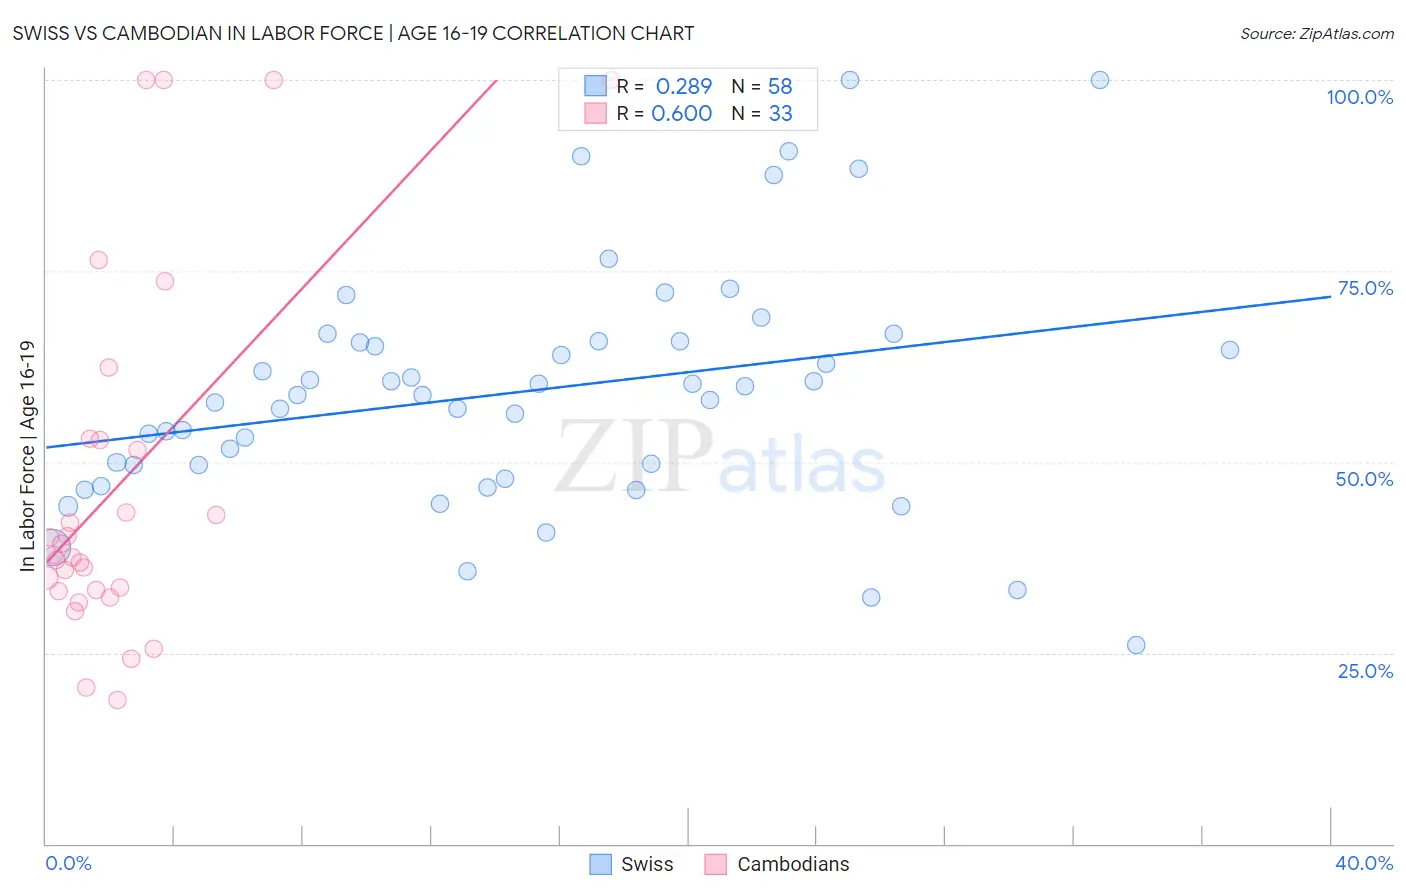
Swiss vs Cambodian In Labor Force | Age 16-19 Correlation Chart
The statistical analysis conducted on geographies consisting of 463,664,152 people shows a weak positive correlation between the proportion of Swiss and labor force participation rate among population between the ages 16 and 19 in the United States with a correlation coefficient (R) of 0.289 and weighted average of 43.3%. Similarly, the statistical analysis conducted on geographies consisting of 102,494,767 people shows a significant positive correlation between the proportion of Cambodians and labor force participation rate among population between the ages 16 and 19 in the United States with a correlation coefficient (R) of 0.600 and weighted average of 37.0%, a difference of 17.0%.
In Labor Force | Age 16-19 Correlation Summary
| Measurement | Swiss | Cambodian |
| Minimum | 26.1% | 18.8% |
| Maximum | 100.0% | 100.0% |
| Range | 73.9% | 81.2% |
| Mean | 59.2% | 47.2% |
| Median | 58.8% | 37.7% |
| Interquartile 25% (IQ1) | 49.5% | 33.2% |
| Interquartile 75% (IQ3) | 65.8% | 53.0% |
| Interquartile Range (IQR) | 16.3% | 19.8% |
| Standard Deviation (Sample) | 15.7% | 23.6% |
| Standard Deviation (Population) | 15.5% | 23.3% |
Similar Demographics by In Labor Force | Age 16-19
Demographics Similar to Swiss by In Labor Force | Age 16-19
In terms of in labor force | age 16-19, the demographic groups most similar to Swiss are Belgian (43.4%, a difference of 0.22%), Ottawa (43.0%, a difference of 0.56%), French Canadian (43.6%, a difference of 0.73%), Scandinavian (43.6%, a difference of 0.80%), and Czech (43.6%, a difference of 0.87%).
| Demographics | Rating | Rank | In Labor Force | Age 16-19 |
| Dutch | 100.0 /100 | #13 | Exceptional 43.8% |
| Chippewa | 100.0 /100 | #14 | Exceptional 43.8% |
| Slovenes | 100.0 /100 | #15 | Exceptional 43.7% |
| Czechs | 100.0 /100 | #16 | Exceptional 43.6% |
| Scandinavians | 100.0 /100 | #17 | Exceptional 43.6% |
| French Canadians | 100.0 /100 | #18 | Exceptional 43.6% |
| Belgians | 100.0 /100 | #19 | Exceptional 43.4% |
| Swiss | 100.0 /100 | #20 | Exceptional 43.3% |
| Ottawa | 100.0 /100 | #21 | Exceptional 43.0% |
| Sudanese | 100.0 /100 | #22 | Exceptional 42.9% |
| Slovaks | 100.0 /100 | #23 | Exceptional 42.6% |
| Bangladeshis | 100.0 /100 | #24 | Exceptional 42.5% |
| German Russians | 100.0 /100 | #25 | Exceptional 42.4% |
| English | 100.0 /100 | #26 | Exceptional 42.4% |
| Welsh | 100.0 /100 | #27 | Exceptional 42.3% |
Demographics Similar to Cambodians by In Labor Force | Age 16-19
In terms of in labor force | age 16-19, the demographic groups most similar to Cambodians are Immigrants from Jordan (36.9%, a difference of 0.12%), Bermudan (36.9%, a difference of 0.13%), Immigrants from Saudi Arabia (37.0%, a difference of 0.15%), Immigrants from Kuwait (36.9%, a difference of 0.16%), and Yaqui (37.1%, a difference of 0.18%).
| Demographics | Rating | Rank | In Labor Force | Age 16-19 |
| Immigrants | Bulgaria | 81.6 /100 | #154 | Excellent 37.3% |
| Immigrants | Lithuania | 80.7 /100 | #155 | Excellent 37.2% |
| Kiowa | 80.4 /100 | #156 | Excellent 37.2% |
| Immigrants | Brazil | 76.5 /100 | #157 | Good 37.1% |
| Ute | 75.7 /100 | #158 | Good 37.1% |
| Yaqui | 74.4 /100 | #159 | Good 37.1% |
| Immigrants | Saudi Arabia | 73.9 /100 | #160 | Good 37.0% |
| Cambodians | 71.5 /100 | #161 | Good 37.0% |
| Immigrants | Jordan | 69.5 /100 | #162 | Good 36.9% |
| Bermudans | 69.3 /100 | #163 | Good 36.9% |
| Immigrants | Kuwait | 68.9 /100 | #164 | Good 36.9% |
| Yakama | 66.9 /100 | #165 | Good 36.9% |
| Immigrants | Western Africa | 66.7 /100 | #166 | Good 36.9% |
| Arabs | 63.6 /100 | #167 | Good 36.8% |
| Palestinians | 63.1 /100 | #168 | Good 36.8% |