Swiss vs Immigrants from Japan In Labor Force | Age 16-19
COMPARE
Swiss
Immigrants from Japan
In Labor Force | Age 16-19
In Labor Force | Age 16-19 Comparison
Swiss
Immigrants from Japan
43.3%
IN LABOR FORCE | AGE 16-19
100.0/ 100
METRIC RATING
20th/ 347
METRIC RANK
34.7%
IN LABOR FORCE | AGE 16-19
1.5/ 100
METRIC RATING
253rd/ 347
METRIC RANK
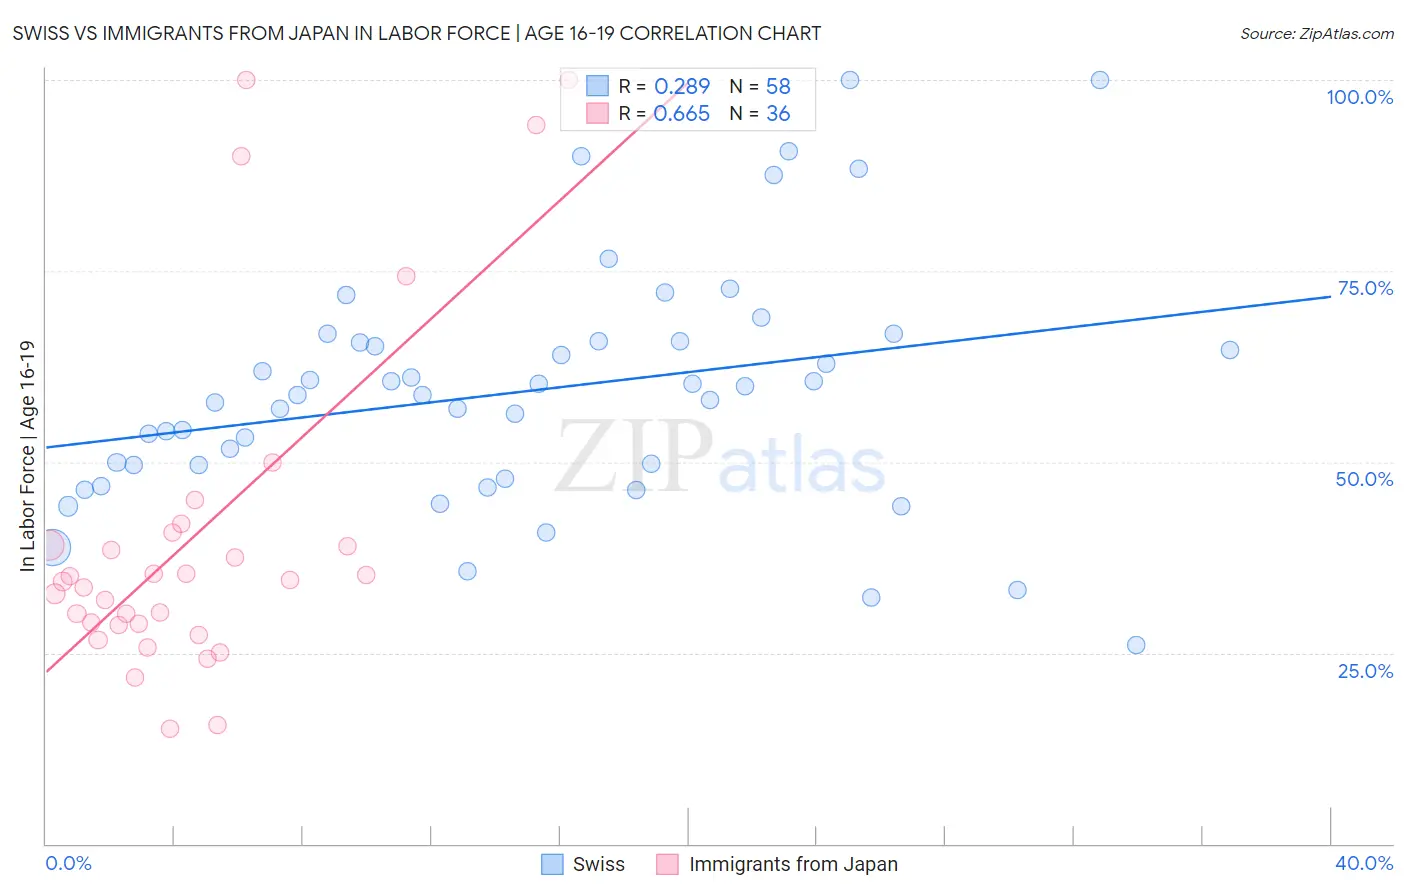
Swiss vs Immigrants from Japan In Labor Force | Age 16-19 Correlation Chart
The statistical analysis conducted on geographies consisting of 463,664,152 people shows a weak positive correlation between the proportion of Swiss and labor force participation rate among population between the ages 16 and 19 in the United States with a correlation coefficient (R) of 0.289 and weighted average of 43.3%. Similarly, the statistical analysis conducted on geographies consisting of 339,742,908 people shows a significant positive correlation between the proportion of Immigrants from Japan and labor force participation rate among population between the ages 16 and 19 in the United States with a correlation coefficient (R) of 0.665 and weighted average of 34.7%, a difference of 24.9%.
In Labor Force | Age 16-19 Correlation Summary
| Measurement | Swiss | Immigrants from Japan |
| Minimum | 26.1% | 15.0% |
| Maximum | 100.0% | 100.0% |
| Range | 73.9% | 85.0% |
| Mean | 59.2% | 40.4% |
| Median | 58.8% | 34.4% |
| Interquartile 25% (IQ1) | 49.5% | 28.7% |
| Interquartile 75% (IQ3) | 65.8% | 39.9% |
| Interquartile Range (IQR) | 16.3% | 11.2% |
| Standard Deviation (Sample) | 15.7% | 22.4% |
| Standard Deviation (Population) | 15.5% | 22.0% |
Similar Demographics by In Labor Force | Age 16-19
Demographics Similar to Swiss by In Labor Force | Age 16-19
In terms of in labor force | age 16-19, the demographic groups most similar to Swiss are Belgian (43.4%, a difference of 0.22%), Ottawa (43.0%, a difference of 0.56%), French Canadian (43.6%, a difference of 0.73%), Scandinavian (43.6%, a difference of 0.80%), and Czech (43.6%, a difference of 0.87%).
| Demographics | Rating | Rank | In Labor Force | Age 16-19 |
| Dutch | 100.0 /100 | #13 | Exceptional 43.8% |
| Chippewa | 100.0 /100 | #14 | Exceptional 43.8% |
| Slovenes | 100.0 /100 | #15 | Exceptional 43.7% |
| Czechs | 100.0 /100 | #16 | Exceptional 43.6% |
| Scandinavians | 100.0 /100 | #17 | Exceptional 43.6% |
| French Canadians | 100.0 /100 | #18 | Exceptional 43.6% |
| Belgians | 100.0 /100 | #19 | Exceptional 43.4% |
| Swiss | 100.0 /100 | #20 | Exceptional 43.3% |
| Ottawa | 100.0 /100 | #21 | Exceptional 43.0% |
| Sudanese | 100.0 /100 | #22 | Exceptional 42.9% |
| Slovaks | 100.0 /100 | #23 | Exceptional 42.6% |
| Bangladeshis | 100.0 /100 | #24 | Exceptional 42.5% |
| German Russians | 100.0 /100 | #25 | Exceptional 42.4% |
| English | 100.0 /100 | #26 | Exceptional 42.4% |
| Welsh | 100.0 /100 | #27 | Exceptional 42.3% |
Demographics Similar to Immigrants from Japan by In Labor Force | Age 16-19
In terms of in labor force | age 16-19, the demographic groups most similar to Immigrants from Japan are Bahamian (34.6%, a difference of 0.12%), Peruvian (34.6%, a difference of 0.16%), Immigrants from South Central Asia (34.6%, a difference of 0.26%), Immigrants from Egypt (34.6%, a difference of 0.27%), and Thai (34.6%, a difference of 0.28%).
| Demographics | Rating | Rank | In Labor Force | Age 16-19 |
| Immigrants | Sri Lanka | 2.4 /100 | #246 | Tragic 34.9% |
| Laotians | 2.4 /100 | #247 | Tragic 34.9% |
| Central Americans | 2.2 /100 | #248 | Tragic 34.8% |
| Immigrants | Ukraine | 2.2 /100 | #249 | Tragic 34.8% |
| Immigrants | Pakistan | 2.0 /100 | #250 | Tragic 34.8% |
| Immigrants | Western Asia | 2.0 /100 | #251 | Tragic 34.8% |
| Immigrants | Chile | 2.0 /100 | #252 | Tragic 34.8% |
| Immigrants | Japan | 1.5 /100 | #253 | Tragic 34.7% |
| Bahamians | 1.4 /100 | #254 | Tragic 34.6% |
| Peruvians | 1.4 /100 | #255 | Tragic 34.6% |
| Immigrants | South Central Asia | 1.3 /100 | #256 | Tragic 34.6% |
| Immigrants | Egypt | 1.2 /100 | #257 | Tragic 34.6% |
| Thais | 1.2 /100 | #258 | Tragic 34.6% |
| Immigrants | Immigrants | 1.2 /100 | #259 | Tragic 34.6% |
| Egyptians | 1.2 /100 | #260 | Tragic 34.5% |