Swiss vs Argentinean Unemployment Among Women with Children Under 6 years
COMPARE
Swiss
Argentinean
Unemployment Among Women with Children Under 6 years
Unemployment Among Women with Children Under 6 years Comparison
Swiss
Argentineans
7.9%
UNEMPLOYMENT AMONG WOMEN WITH CHILDREN UNDER 6 YEARS
12.3/ 100
METRIC RATING
212th/ 347
METRIC RANK
7.2%
UNEMPLOYMENT AMONG WOMEN WITH CHILDREN UNDER 6 YEARS
96.2/ 100
METRIC RATING
114th/ 347
METRIC RANK
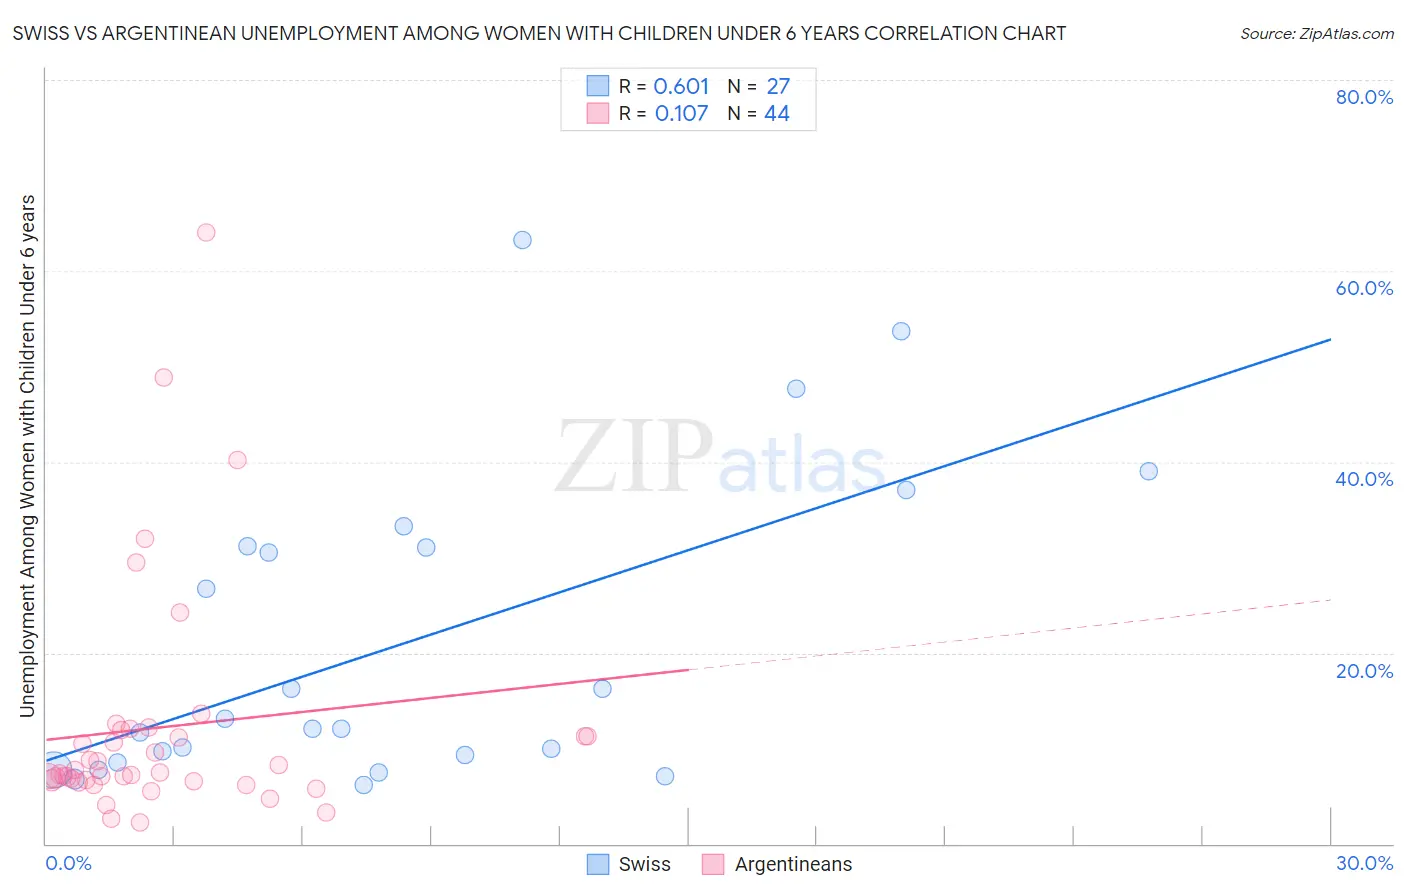
Swiss vs Argentinean Unemployment Among Women with Children Under 6 years Correlation Chart
The statistical analysis conducted on geographies consisting of 326,858,095 people shows a significant positive correlation between the proportion of Swiss and unemployment rate among women with children under the age of 6 in the United States with a correlation coefficient (R) of 0.601 and weighted average of 7.9%. Similarly, the statistical analysis conducted on geographies consisting of 240,769,726 people shows a poor positive correlation between the proportion of Argentineans and unemployment rate among women with children under the age of 6 in the United States with a correlation coefficient (R) of 0.107 and weighted average of 7.2%, a difference of 9.1%.
Unemployment Among Women with Children Under 6 years Correlation Summary
| Measurement | Swiss | Argentinean |
| Minimum | 6.2% | 2.2% |
| Maximum | 63.2% | 64.0% |
| Range | 57.1% | 61.8% |
| Mean | 20.9% | 12.2% |
| Median | 12.0% | 7.4% |
| Interquartile 25% (IQ1) | 8.5% | 6.6% |
| Interquartile 75% (IQ3) | 31.1% | 11.6% |
| Interquartile Range (IQR) | 22.6% | 5.0% |
| Standard Deviation (Sample) | 16.2% | 12.4% |
| Standard Deviation (Population) | 15.9% | 12.3% |
Similar Demographics by Unemployment Among Women with Children Under 6 years
Demographics Similar to Swiss by Unemployment Among Women with Children Under 6 years
In terms of unemployment among women with children under 6 years, the demographic groups most similar to Swiss are Scottish (7.9%, a difference of 0.13%), Spanish (7.9%, a difference of 0.16%), Ecuadorian (7.9%, a difference of 0.17%), Immigrants from Lebanon (7.9%, a difference of 0.19%), and Immigrants from Nigeria (7.9%, a difference of 0.31%).
| Demographics | Rating | Rank | Unemployment Among Women with Children Under 6 years |
| Immigrants | Immigrants | 21.4 /100 | #205 | Fair 7.8% |
| Hungarians | 21.2 /100 | #206 | Fair 7.8% |
| Canadians | 20.6 /100 | #207 | Fair 7.8% |
| Immigrants | Syria | 18.9 /100 | #208 | Poor 7.8% |
| Costa Ricans | 17.6 /100 | #209 | Poor 7.8% |
| Poles | 16.0 /100 | #210 | Poor 7.9% |
| Immigrants | Ecuador | 14.9 /100 | #211 | Poor 7.9% |
| Swiss | 12.3 /100 | #212 | Poor 7.9% |
| Scottish | 11.4 /100 | #213 | Poor 7.9% |
| Spanish | 11.3 /100 | #214 | Poor 7.9% |
| Ecuadorians | 11.2 /100 | #215 | Poor 7.9% |
| Immigrants | Lebanon | 11.1 /100 | #216 | Poor 7.9% |
| Immigrants | Nigeria | 10.3 /100 | #217 | Poor 7.9% |
| Moroccans | 9.7 /100 | #218 | Tragic 7.9% |
| Arabs | 9.4 /100 | #219 | Tragic 7.9% |
Demographics Similar to Argentineans by Unemployment Among Women with Children Under 6 years
In terms of unemployment among women with children under 6 years, the demographic groups most similar to Argentineans are Nicaraguan (7.2%, a difference of 0.040%), Immigrants from Italy (7.2%, a difference of 0.080%), Israeli (7.2%, a difference of 0.12%), Armenian (7.2%, a difference of 0.17%), and Norwegian (7.2%, a difference of 0.23%).
| Demographics | Rating | Rank | Unemployment Among Women with Children Under 6 years |
| Immigrants | Kazakhstan | 97.1 /100 | #107 | Exceptional 7.2% |
| Eastern Europeans | 96.9 /100 | #108 | Exceptional 7.2% |
| Australians | 96.9 /100 | #109 | Exceptional 7.2% |
| Palestinians | 96.8 /100 | #110 | Exceptional 7.2% |
| Norwegians | 96.7 /100 | #111 | Exceptional 7.2% |
| Israelis | 96.5 /100 | #112 | Exceptional 7.2% |
| Nicaraguans | 96.3 /100 | #113 | Exceptional 7.2% |
| Argentineans | 96.2 /100 | #114 | Exceptional 7.2% |
| Immigrants | Italy | 96.1 /100 | #115 | Exceptional 7.2% |
| Armenians | 95.9 /100 | #116 | Exceptional 7.2% |
| Immigrants | Kenya | 95.4 /100 | #117 | Exceptional 7.3% |
| Serbians | 94.5 /100 | #118 | Exceptional 7.3% |
| South Africans | 94.1 /100 | #119 | Exceptional 7.3% |
| Iraqis | 93.9 /100 | #120 | Exceptional 7.3% |
| Immigrants | Chile | 93.5 /100 | #121 | Exceptional 7.3% |