Swedish vs Aleut In Labor Force | Age 35-44
COMPARE
Swedish
Aleut
In Labor Force | Age 35-44
In Labor Force | Age 35-44 Comparison
Swedes
Aleuts
85.0%
IN LABOR FORCE | AGE 35-44
99.2/ 100
METRIC RATING
64th/ 347
METRIC RANK
84.4%
IN LABOR FORCE | AGE 35-44
59.1/ 100
METRIC RATING
163rd/ 347
METRIC RANK
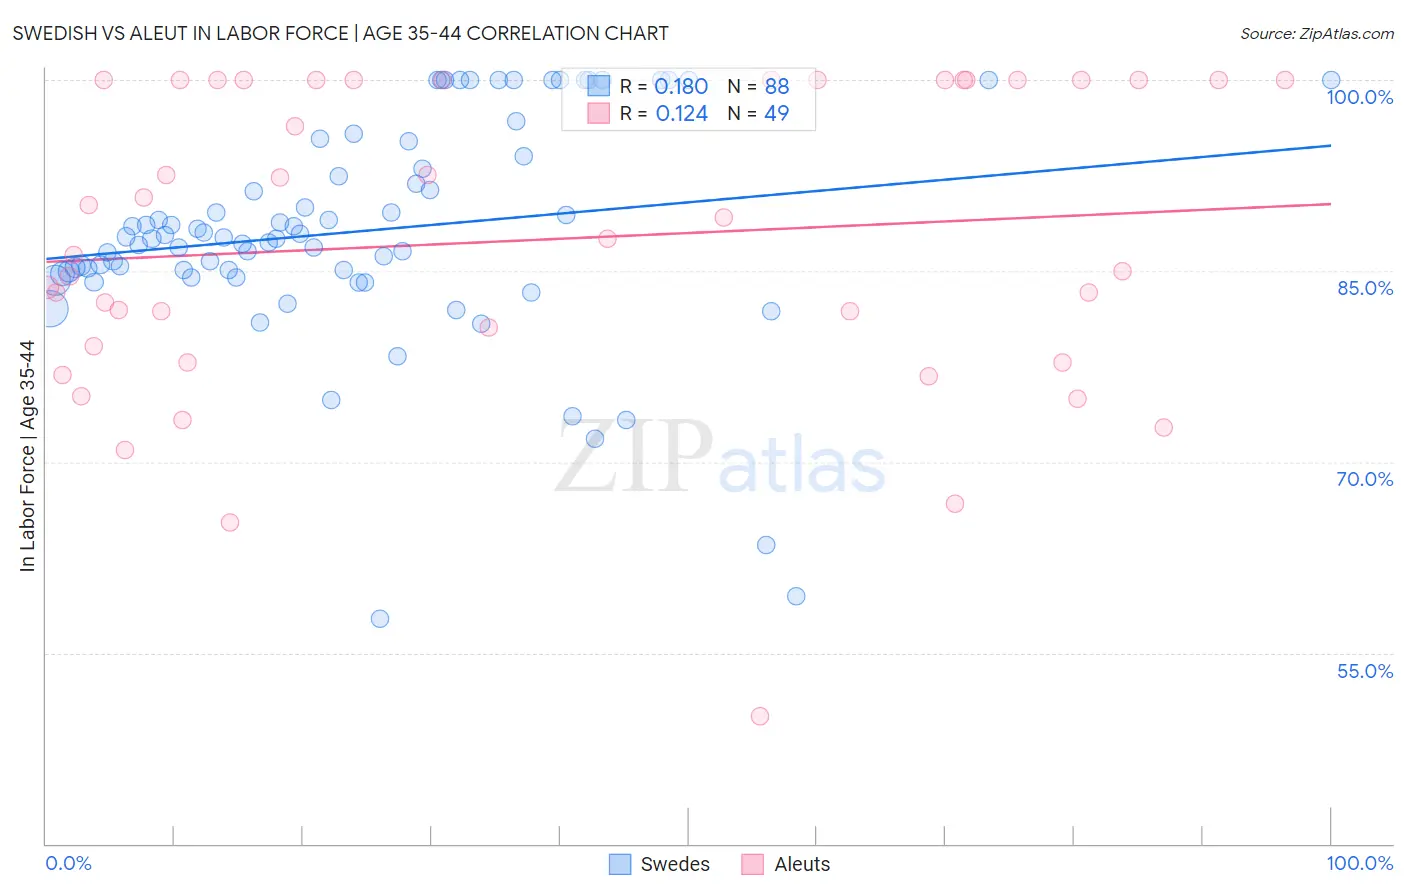
Swedish vs Aleut In Labor Force | Age 35-44 Correlation Chart
The statistical analysis conducted on geographies consisting of 538,724,566 people shows a poor positive correlation between the proportion of Swedes and labor force participation rate among population between the ages 35 and 44 in the United States with a correlation coefficient (R) of 0.180 and weighted average of 85.0%. Similarly, the statistical analysis conducted on geographies consisting of 61,775,675 people shows a poor positive correlation between the proportion of Aleuts and labor force participation rate among population between the ages 35 and 44 in the United States with a correlation coefficient (R) of 0.124 and weighted average of 84.4%, a difference of 0.73%.
In Labor Force | Age 35-44 Correlation Summary
| Measurement | Swedish | Aleut |
| Minimum | 57.7% | 50.0% |
| Maximum | 100.0% | 100.0% |
| Range | 42.3% | 50.0% |
| Mean | 88.1% | 87.4% |
| Median | 87.6% | 87.5% |
| Interquartile 25% (IQ1) | 84.9% | 78.4% |
| Interquartile 75% (IQ3) | 93.5% | 100.0% |
| Interquartile Range (IQR) | 8.6% | 21.6% |
| Standard Deviation (Sample) | 8.7% | 12.0% |
| Standard Deviation (Population) | 8.6% | 11.9% |
Similar Demographics by In Labor Force | Age 35-44
Demographics Similar to Swedes by In Labor Force | Age 35-44
In terms of in labor force | age 35-44, the demographic groups most similar to Swedes are Immigrants from Moldova (85.0%, a difference of 0.010%), Immigrants from Uganda (85.0%, a difference of 0.010%), Immigrants from Brazil (85.0%, a difference of 0.010%), Immigrants from Latvia (85.0%, a difference of 0.020%), and Immigrants from Haiti (85.0%, a difference of 0.020%).
| Demographics | Rating | Rank | In Labor Force | Age 35-44 |
| Chinese | 99.4 /100 | #57 | Exceptional 85.1% |
| Slovaks | 99.4 /100 | #58 | Exceptional 85.1% |
| Serbians | 99.4 /100 | #59 | Exceptional 85.1% |
| Albanians | 99.4 /100 | #60 | Exceptional 85.1% |
| Immigrants | Latvia | 99.3 /100 | #61 | Exceptional 85.0% |
| Immigrants | Moldova | 99.3 /100 | #62 | Exceptional 85.0% |
| Immigrants | Uganda | 99.3 /100 | #63 | Exceptional 85.0% |
| Swedes | 99.2 /100 | #64 | Exceptional 85.0% |
| Immigrants | Brazil | 99.2 /100 | #65 | Exceptional 85.0% |
| Immigrants | Haiti | 99.1 /100 | #66 | Exceptional 85.0% |
| Immigrants | Italy | 99.1 /100 | #67 | Exceptional 85.0% |
| Italians | 99.1 /100 | #68 | Exceptional 85.0% |
| Sudanese | 99.0 /100 | #69 | Exceptional 85.0% |
| Brazilians | 99.0 /100 | #70 | Exceptional 85.0% |
| Russians | 99.0 /100 | #71 | Exceptional 85.0% |
Demographics Similar to Aleuts by In Labor Force | Age 35-44
In terms of in labor force | age 35-44, the demographic groups most similar to Aleuts are Immigrants from Hungary (84.4%, a difference of 0.0%), Nigerian (84.4%, a difference of 0.0%), Immigrants from Senegal (84.4%, a difference of 0.010%), Immigrants from Kazakhstan (84.4%, a difference of 0.010%), and Immigrants from Venezuela (84.4%, a difference of 0.010%).
| Demographics | Rating | Rank | In Labor Force | Age 35-44 |
| Immigrants | Israel | 64.3 /100 | #156 | Good 84.4% |
| Immigrants | Austria | 63.8 /100 | #157 | Good 84.4% |
| Jamaicans | 62.7 /100 | #158 | Good 84.4% |
| Immigrants | Senegal | 60.4 /100 | #159 | Good 84.4% |
| Immigrants | Kazakhstan | 60.4 /100 | #160 | Good 84.4% |
| Immigrants | Venezuela | 60.0 /100 | #161 | Good 84.4% |
| Immigrants | Hungary | 59.4 /100 | #162 | Average 84.4% |
| Aleuts | 59.1 /100 | #163 | Average 84.4% |
| Nigerians | 58.9 /100 | #164 | Average 84.4% |
| Venezuelans | 58.1 /100 | #165 | Average 84.4% |
| Alsatians | 55.2 /100 | #166 | Average 84.4% |
| Immigrants | Portugal | 55.2 /100 | #167 | Average 84.4% |
| Irish | 53.1 /100 | #168 | Average 84.4% |
| Immigrants | Afghanistan | 52.7 /100 | #169 | Average 84.4% |
| Immigrants | Jordan | 52.5 /100 | #170 | Average 84.4% |