African vs Samoan In Labor Force | Age 16-19
COMPARE
African
Samoan
In Labor Force | Age 16-19
In Labor Force | Age 16-19 Comparison
Africans
Samoans
38.0%
IN LABOR FORCE | AGE 16-19
95.6/ 100
METRIC RATING
126th/ 347
METRIC RANK
39.1%
IN LABOR FORCE | AGE 16-19
99.6/ 100
METRIC RATING
86th/ 347
METRIC RANK
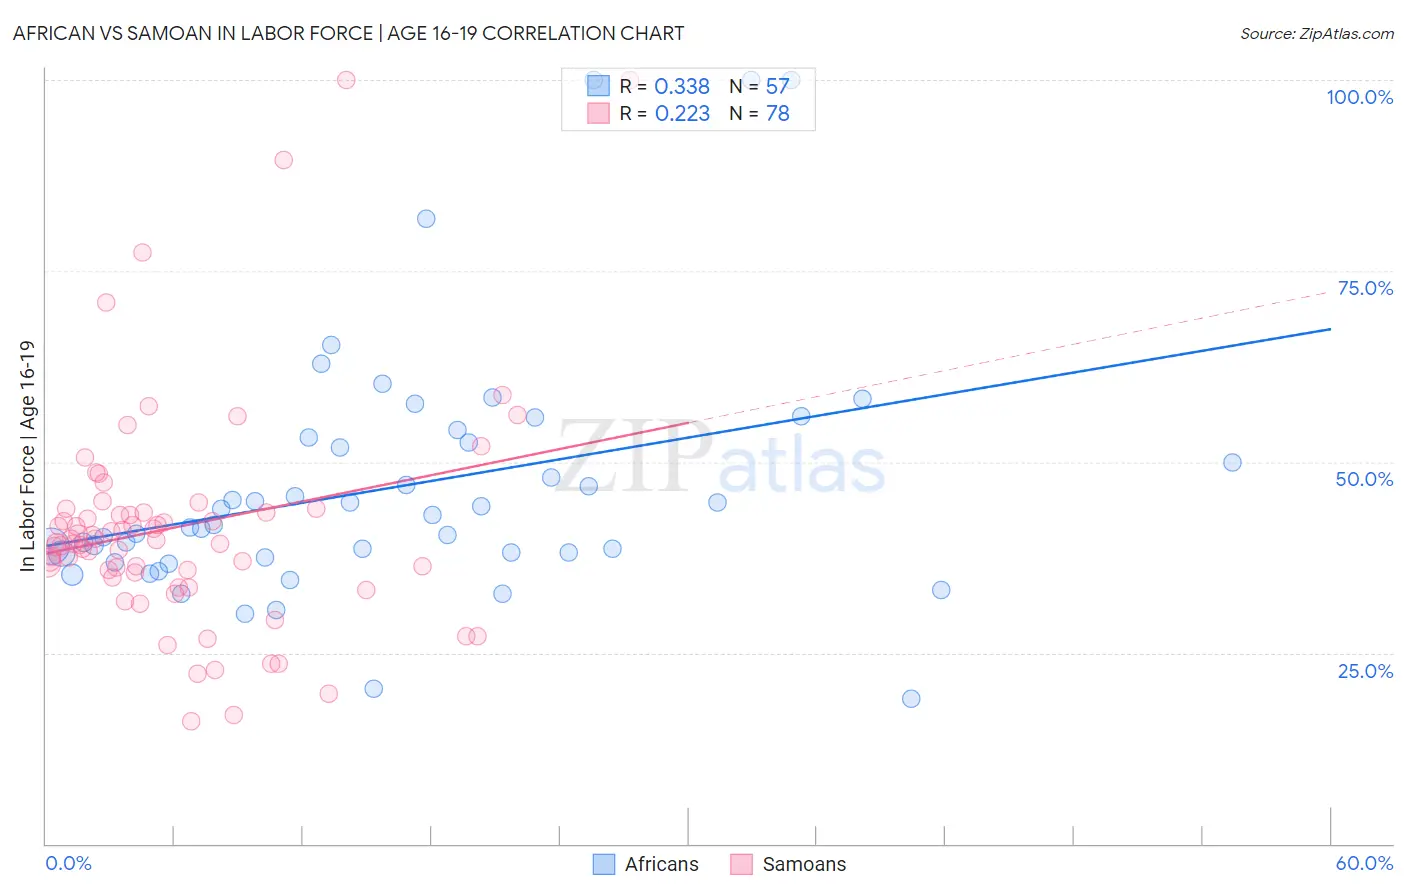
African vs Samoan In Labor Force | Age 16-19 Correlation Chart
The statistical analysis conducted on geographies consisting of 469,169,744 people shows a mild positive correlation between the proportion of Africans and labor force participation rate among population between the ages 16 and 19 in the United States with a correlation coefficient (R) of 0.338 and weighted average of 38.0%. Similarly, the statistical analysis conducted on geographies consisting of 225,011,822 people shows a weak positive correlation between the proportion of Samoans and labor force participation rate among population between the ages 16 and 19 in the United States with a correlation coefficient (R) of 0.223 and weighted average of 39.1%, a difference of 3.0%.
In Labor Force | Age 16-19 Correlation Summary
| Measurement | African | Samoan |
| Minimum | 19.0% | 16.0% |
| Maximum | 100.0% | 100.0% |
| Range | 81.0% | 84.0% |
| Mean | 46.7% | 41.6% |
| Median | 41.8% | 39.5% |
| Interquartile 25% (IQ1) | 37.8% | 35.5% |
| Interquartile 75% (IQ3) | 52.9% | 43.3% |
| Interquartile Range (IQR) | 15.1% | 7.9% |
| Standard Deviation (Sample) | 16.6% | 15.2% |
| Standard Deviation (Population) | 16.5% | 15.1% |
Similar Demographics by In Labor Force | Age 16-19
Demographics Similar to Africans by In Labor Force | Age 16-19
In terms of in labor force | age 16-19, the demographic groups most similar to Africans are Choctaw (38.0%, a difference of 0.010%), New Zealander (38.0%, a difference of 0.010%), Spaniard (38.0%, a difference of 0.030%), Immigrants from Zimbabwe (38.0%, a difference of 0.060%), and Immigrants from Africa (38.0%, a difference of 0.16%).
| Demographics | Rating | Rank | In Labor Force | Age 16-19 |
| Assyrians/Chaldeans/Syriacs | 97.8 /100 | #119 | Exceptional 38.3% |
| Ukrainians | 97.6 /100 | #120 | Exceptional 38.3% |
| Ethiopians | 97.4 /100 | #121 | Exceptional 38.2% |
| Guamanians/Chamorros | 97.4 /100 | #122 | Exceptional 38.2% |
| Seminole | 96.7 /100 | #123 | Exceptional 38.1% |
| Immigrants | England | 96.4 /100 | #124 | Exceptional 38.1% |
| Immigrants | Africa | 96.1 /100 | #125 | Exceptional 38.0% |
| Africans | 95.6 /100 | #126 | Exceptional 38.0% |
| Choctaw | 95.6 /100 | #127 | Exceptional 38.0% |
| New Zealanders | 95.6 /100 | #128 | Exceptional 38.0% |
| Spaniards | 95.5 /100 | #129 | Exceptional 38.0% |
| Immigrants | Zimbabwe | 95.4 /100 | #130 | Exceptional 38.0% |
| Immigrants | Austria | 95.0 /100 | #131 | Exceptional 37.9% |
| Immigrants | Oceania | 94.7 /100 | #132 | Exceptional 37.9% |
| Cheyenne | 94.6 /100 | #133 | Exceptional 37.9% |
Demographics Similar to Samoans by In Labor Force | Age 16-19
In terms of in labor force | age 16-19, the demographic groups most similar to Samoans are Creek (39.1%, a difference of 0.020%), Immigrants from Germany (39.1%, a difference of 0.080%), Puget Sound Salish (39.1%, a difference of 0.16%), Alaska Native (39.1%, a difference of 0.16%), and Immigrants from Uganda (39.2%, a difference of 0.17%).
| Demographics | Rating | Rank | In Labor Force | Age 16-19 |
| Marshallese | 99.8 /100 | #79 | Exceptional 39.5% |
| Immigrants | Iraq | 99.8 /100 | #80 | Exceptional 39.4% |
| Shoshone | 99.7 /100 | #81 | Exceptional 39.3% |
| Basques | 99.7 /100 | #82 | Exceptional 39.3% |
| Spanish | 99.7 /100 | #83 | Exceptional 39.3% |
| Immigrants | Uganda | 99.7 /100 | #84 | Exceptional 39.2% |
| Creek | 99.6 /100 | #85 | Exceptional 39.1% |
| Samoans | 99.6 /100 | #86 | Exceptional 39.1% |
| Immigrants | Germany | 99.6 /100 | #87 | Exceptional 39.1% |
| Puget Sound Salish | 99.6 /100 | #88 | Exceptional 39.1% |
| Alaska Natives | 99.6 /100 | #89 | Exceptional 39.1% |
| Immigrants | Burma/Myanmar | 99.5 /100 | #90 | Exceptional 39.0% |
| Spanish Americans | 99.5 /100 | #91 | Exceptional 39.0% |
| Osage | 99.4 /100 | #92 | Exceptional 39.0% |
| Blackfeet | 99.4 /100 | #93 | Exceptional 38.9% |