Central American vs Samoan In Labor Force | Age 16-19
COMPARE
Central American
Samoan
In Labor Force | Age 16-19
In Labor Force | Age 16-19 Comparison
Central Americans
Samoans
34.8%
IN LABOR FORCE | AGE 16-19
2.2/ 100
METRIC RATING
248th/ 347
METRIC RANK
39.1%
IN LABOR FORCE | AGE 16-19
99.6/ 100
METRIC RATING
86th/ 347
METRIC RANK
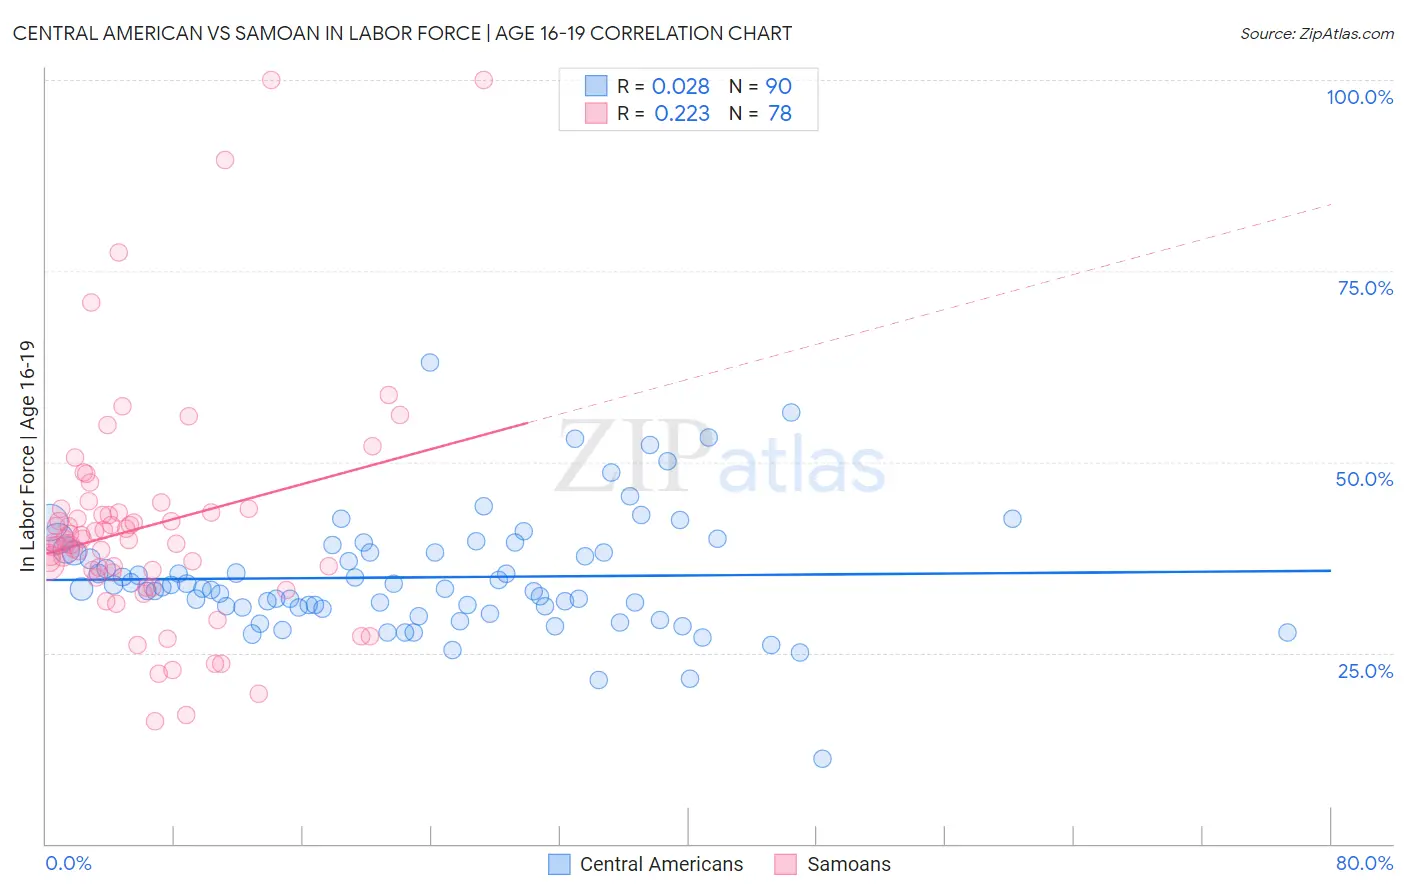
Central American vs Samoan In Labor Force | Age 16-19 Correlation Chart
The statistical analysis conducted on geographies consisting of 503,353,635 people shows no correlation between the proportion of Central Americans and labor force participation rate among population between the ages 16 and 19 in the United States with a correlation coefficient (R) of 0.028 and weighted average of 34.8%. Similarly, the statistical analysis conducted on geographies consisting of 225,011,822 people shows a weak positive correlation between the proportion of Samoans and labor force participation rate among population between the ages 16 and 19 in the United States with a correlation coefficient (R) of 0.223 and weighted average of 39.1%, a difference of 12.4%.
In Labor Force | Age 16-19 Correlation Summary
| Measurement | Central American | Samoan |
| Minimum | 11.1% | 16.0% |
| Maximum | 63.0% | 100.0% |
| Range | 51.9% | 84.0% |
| Mean | 34.9% | 41.6% |
| Median | 33.4% | 39.5% |
| Interquartile 25% (IQ1) | 31.0% | 35.5% |
| Interquartile 75% (IQ3) | 38.2% | 43.3% |
| Interquartile Range (IQR) | 7.2% | 7.9% |
| Standard Deviation (Sample) | 7.8% | 15.2% |
| Standard Deviation (Population) | 7.8% | 15.1% |
Similar Demographics by In Labor Force | Age 16-19
Demographics Similar to Central Americans by In Labor Force | Age 16-19
In terms of in labor force | age 16-19, the demographic groups most similar to Central Americans are Immigrants from Ukraine (34.8%, a difference of 0.030%), Immigrants from Sri Lanka (34.9%, a difference of 0.090%), Laotian (34.9%, a difference of 0.090%), Immigrants from Greece (34.9%, a difference of 0.12%), and Immigrants from Pakistan (34.8%, a difference of 0.13%).
| Demographics | Rating | Rank | In Labor Force | Age 16-19 |
| Immigrants | Ireland | 2.9 /100 | #241 | Tragic 35.0% |
| Uruguayans | 2.6 /100 | #242 | Tragic 34.9% |
| Pueblo | 2.6 /100 | #243 | Tragic 34.9% |
| Immigrants | Turkey | 2.6 /100 | #244 | Tragic 34.9% |
| Immigrants | Greece | 2.4 /100 | #245 | Tragic 34.9% |
| Immigrants | Sri Lanka | 2.4 /100 | #246 | Tragic 34.9% |
| Laotians | 2.4 /100 | #247 | Tragic 34.9% |
| Central Americans | 2.2 /100 | #248 | Tragic 34.8% |
| Immigrants | Ukraine | 2.2 /100 | #249 | Tragic 34.8% |
| Immigrants | Pakistan | 2.0 /100 | #250 | Tragic 34.8% |
| Immigrants | Western Asia | 2.0 /100 | #251 | Tragic 34.8% |
| Immigrants | Chile | 2.0 /100 | #252 | Tragic 34.8% |
| Immigrants | Japan | 1.5 /100 | #253 | Tragic 34.7% |
| Bahamians | 1.4 /100 | #254 | Tragic 34.6% |
| Peruvians | 1.4 /100 | #255 | Tragic 34.6% |
Demographics Similar to Samoans by In Labor Force | Age 16-19
In terms of in labor force | age 16-19, the demographic groups most similar to Samoans are Creek (39.1%, a difference of 0.020%), Immigrants from Germany (39.1%, a difference of 0.080%), Puget Sound Salish (39.1%, a difference of 0.16%), Alaska Native (39.1%, a difference of 0.16%), and Immigrants from Uganda (39.2%, a difference of 0.17%).
| Demographics | Rating | Rank | In Labor Force | Age 16-19 |
| Marshallese | 99.8 /100 | #79 | Exceptional 39.5% |
| Immigrants | Iraq | 99.8 /100 | #80 | Exceptional 39.4% |
| Shoshone | 99.7 /100 | #81 | Exceptional 39.3% |
| Basques | 99.7 /100 | #82 | Exceptional 39.3% |
| Spanish | 99.7 /100 | #83 | Exceptional 39.3% |
| Immigrants | Uganda | 99.7 /100 | #84 | Exceptional 39.2% |
| Creek | 99.6 /100 | #85 | Exceptional 39.1% |
| Samoans | 99.6 /100 | #86 | Exceptional 39.1% |
| Immigrants | Germany | 99.6 /100 | #87 | Exceptional 39.1% |
| Puget Sound Salish | 99.6 /100 | #88 | Exceptional 39.1% |
| Alaska Natives | 99.6 /100 | #89 | Exceptional 39.1% |
| Immigrants | Burma/Myanmar | 99.5 /100 | #90 | Exceptional 39.0% |
| Spanish Americans | 99.5 /100 | #91 | Exceptional 39.0% |
| Osage | 99.4 /100 | #92 | Exceptional 39.0% |
| Blackfeet | 99.4 /100 | #93 | Exceptional 38.9% |