Polish vs Samoan In Labor Force | Age 16-19
COMPARE
Polish
Samoan
In Labor Force | Age 16-19
In Labor Force | Age 16-19 Comparison
Poles
Samoans
42.1%
IN LABOR FORCE | AGE 16-19
100.0/ 100
METRIC RATING
28th/ 347
METRIC RANK
39.1%
IN LABOR FORCE | AGE 16-19
99.6/ 100
METRIC RATING
86th/ 347
METRIC RANK
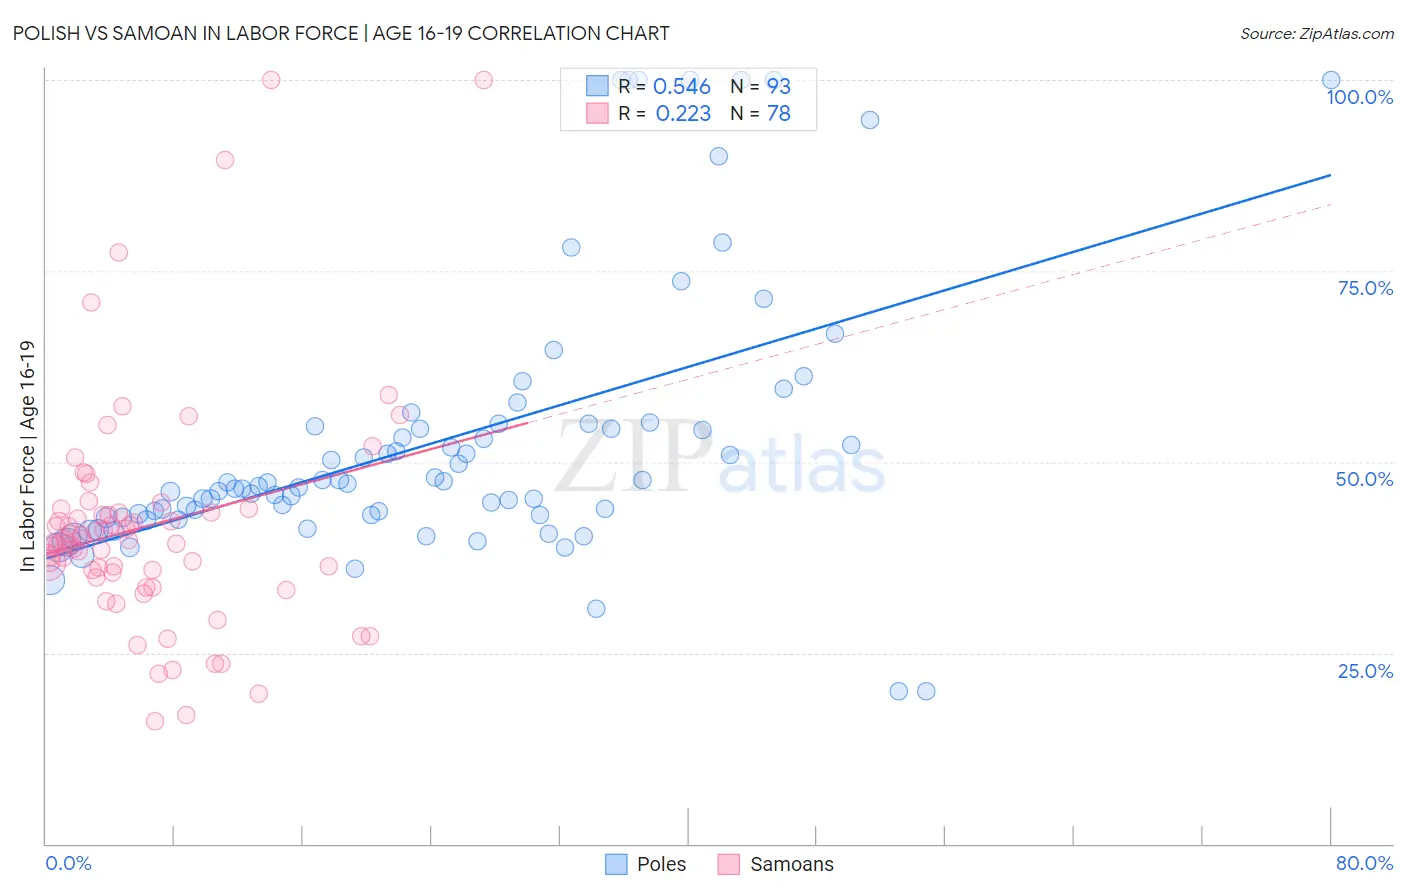
Polish vs Samoan In Labor Force | Age 16-19 Correlation Chart
The statistical analysis conducted on geographies consisting of 556,989,344 people shows a substantial positive correlation between the proportion of Poles and labor force participation rate among population between the ages 16 and 19 in the United States with a correlation coefficient (R) of 0.546 and weighted average of 42.1%. Similarly, the statistical analysis conducted on geographies consisting of 225,011,822 people shows a weak positive correlation between the proportion of Samoans and labor force participation rate among population between the ages 16 and 19 in the United States with a correlation coefficient (R) of 0.223 and weighted average of 39.1%, a difference of 7.6%.
In Labor Force | Age 16-19 Correlation Summary
| Measurement | Polish | Samoan |
| Minimum | 20.0% | 16.0% |
| Maximum | 100.0% | 100.0% |
| Range | 80.0% | 84.0% |
| Mean | 52.6% | 41.6% |
| Median | 46.8% | 39.5% |
| Interquartile 25% (IQ1) | 42.9% | 35.5% |
| Interquartile 75% (IQ3) | 54.9% | 43.3% |
| Interquartile Range (IQR) | 12.0% | 7.9% |
| Standard Deviation (Sample) | 17.8% | 15.2% |
| Standard Deviation (Population) | 17.7% | 15.1% |
Similar Demographics by In Labor Force | Age 16-19
Demographics Similar to Poles by In Labor Force | Age 16-19
In terms of in labor force | age 16-19, the demographic groups most similar to Poles are French (42.1%, a difference of 0.050%), Welsh (42.3%, a difference of 0.29%), Scottish (42.0%, a difference of 0.33%), Irish (42.0%, a difference of 0.40%), and English (42.4%, a difference of 0.57%).
| Demographics | Rating | Rank | In Labor Force | Age 16-19 |
| Ottawa | 100.0 /100 | #21 | Exceptional 43.0% |
| Sudanese | 100.0 /100 | #22 | Exceptional 42.9% |
| Slovaks | 100.0 /100 | #23 | Exceptional 42.6% |
| Bangladeshis | 100.0 /100 | #24 | Exceptional 42.5% |
| German Russians | 100.0 /100 | #25 | Exceptional 42.4% |
| English | 100.0 /100 | #26 | Exceptional 42.4% |
| Welsh | 100.0 /100 | #27 | Exceptional 42.3% |
| Poles | 100.0 /100 | #28 | Exceptional 42.1% |
| French | 100.0 /100 | #29 | Exceptional 42.1% |
| Scottish | 100.0 /100 | #30 | Exceptional 42.0% |
| Irish | 100.0 /100 | #31 | Exceptional 42.0% |
| Czechoslovakians | 100.0 /100 | #32 | Exceptional 41.9% |
| Liberians | 100.0 /100 | #33 | Exceptional 41.8% |
| Immigrants | Bosnia and Herzegovina | 100.0 /100 | #34 | Exceptional 41.8% |
| Yugoslavians | 100.0 /100 | #35 | Exceptional 41.8% |
Demographics Similar to Samoans by In Labor Force | Age 16-19
In terms of in labor force | age 16-19, the demographic groups most similar to Samoans are Creek (39.1%, a difference of 0.020%), Immigrants from Germany (39.1%, a difference of 0.080%), Puget Sound Salish (39.1%, a difference of 0.16%), Alaska Native (39.1%, a difference of 0.16%), and Immigrants from Uganda (39.2%, a difference of 0.17%).
| Demographics | Rating | Rank | In Labor Force | Age 16-19 |
| Marshallese | 99.8 /100 | #79 | Exceptional 39.5% |
| Immigrants | Iraq | 99.8 /100 | #80 | Exceptional 39.4% |
| Shoshone | 99.7 /100 | #81 | Exceptional 39.3% |
| Basques | 99.7 /100 | #82 | Exceptional 39.3% |
| Spanish | 99.7 /100 | #83 | Exceptional 39.3% |
| Immigrants | Uganda | 99.7 /100 | #84 | Exceptional 39.2% |
| Creek | 99.6 /100 | #85 | Exceptional 39.1% |
| Samoans | 99.6 /100 | #86 | Exceptional 39.1% |
| Immigrants | Germany | 99.6 /100 | #87 | Exceptional 39.1% |
| Puget Sound Salish | 99.6 /100 | #88 | Exceptional 39.1% |
| Alaska Natives | 99.6 /100 | #89 | Exceptional 39.1% |
| Immigrants | Burma/Myanmar | 99.5 /100 | #90 | Exceptional 39.0% |
| Spanish Americans | 99.5 /100 | #91 | Exceptional 39.0% |
| Osage | 99.4 /100 | #92 | Exceptional 39.0% |
| Blackfeet | 99.4 /100 | #93 | Exceptional 38.9% |