Spanish vs Immigrants from Nepal Professional Degree
COMPARE
Spanish
Immigrants from Nepal
Professional Degree
Professional Degree Comparison
Spanish
Immigrants from Nepal
4.2%
PROFESSIONAL DEGREE
23.0/ 100
METRIC RATING
196th/ 347
METRIC RANK
4.8%
PROFESSIONAL DEGREE
91.4/ 100
METRIC RATING
131st/ 347
METRIC RANK
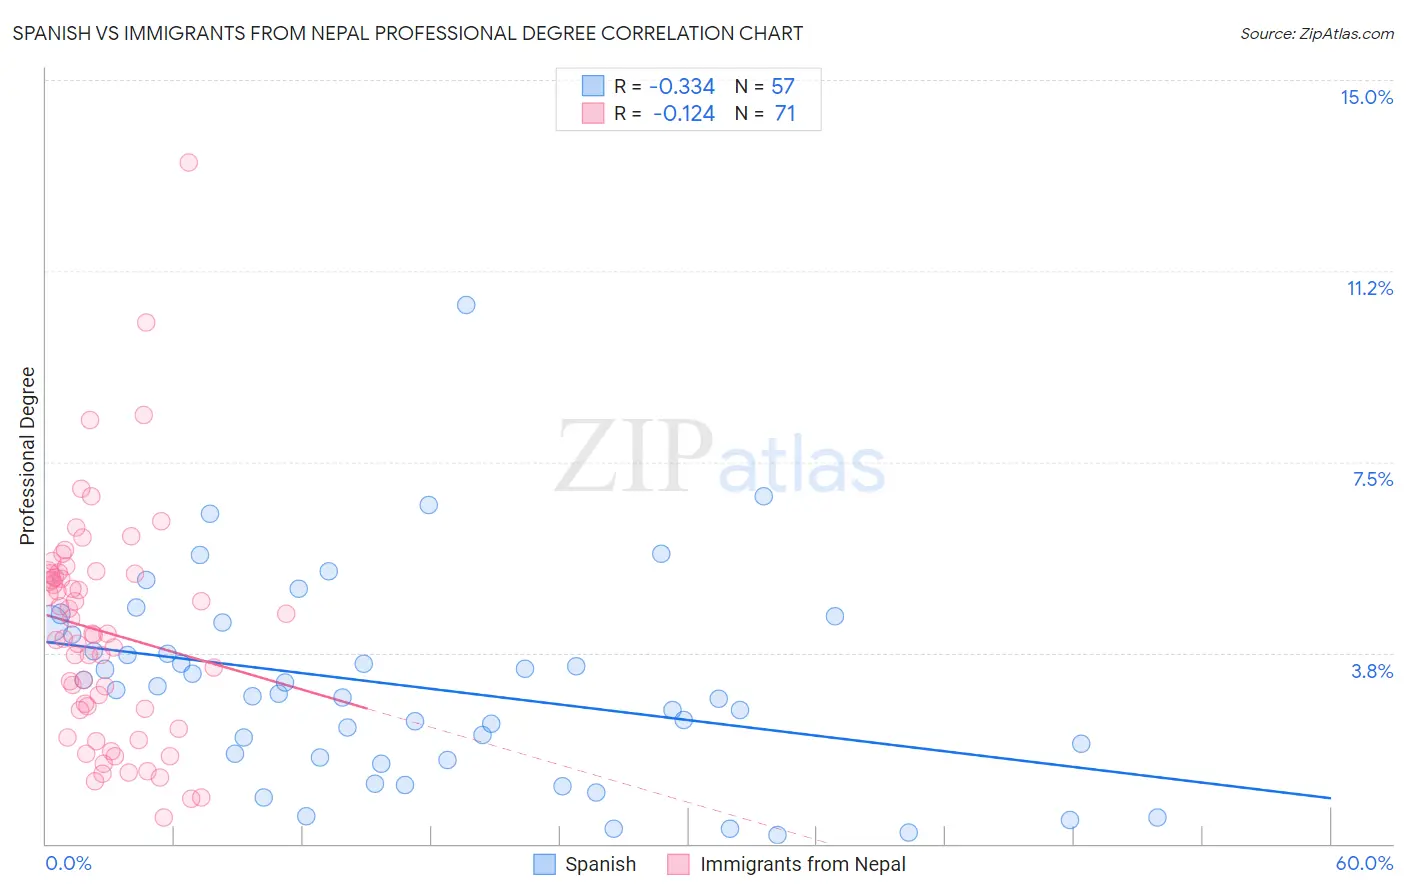
Spanish vs Immigrants from Nepal Professional Degree Correlation Chart
The statistical analysis conducted on geographies consisting of 420,419,286 people shows a mild negative correlation between the proportion of Spanish and percentage of population with at least professional degree education in the United States with a correlation coefficient (R) of -0.334 and weighted average of 4.2%. Similarly, the statistical analysis conducted on geographies consisting of 186,663,836 people shows a poor negative correlation between the proportion of Immigrants from Nepal and percentage of population with at least professional degree education in the United States with a correlation coefficient (R) of -0.124 and weighted average of 4.8%, a difference of 13.6%.
Professional Degree Correlation Summary
| Measurement | Spanish | Immigrants from Nepal |
| Minimum | 0.17% | 0.52% |
| Maximum | 10.6% | 13.4% |
| Range | 10.4% | 12.9% |
| Mean | 3.1% | 4.2% |
| Median | 2.9% | 4.1% |
| Interquartile 25% (IQ1) | 1.7% | 2.6% |
| Interquartile 75% (IQ3) | 4.2% | 5.3% |
| Interquartile Range (IQR) | 2.5% | 2.7% |
| Standard Deviation (Sample) | 2.0% | 2.2% |
| Standard Deviation (Population) | 2.0% | 2.2% |
Similar Demographics by Professional Degree
Demographics Similar to Spanish by Professional Degree
In terms of professional degree, the demographic groups most similar to Spanish are Czechoslovakian (4.2%, a difference of 0.14%), Immigrants from Middle Africa (4.2%, a difference of 0.19%), Nigerian (4.2%, a difference of 0.33%), Norwegian (4.2%, a difference of 0.56%), and Scandinavian (4.2%, a difference of 0.57%).
| Demographics | Rating | Rank | Professional Degree |
| Slovaks | 30.7 /100 | #189 | Fair 4.3% |
| Immigrants | Poland | 29.2 /100 | #190 | Fair 4.3% |
| Sri Lankans | 29.0 /100 | #191 | Fair 4.3% |
| Ghanaians | 27.3 /100 | #192 | Fair 4.3% |
| French | 27.1 /100 | #193 | Fair 4.2% |
| Scandinavians | 25.8 /100 | #194 | Fair 4.2% |
| Nigerians | 24.6 /100 | #195 | Fair 4.2% |
| Spanish | 23.0 /100 | #196 | Fair 4.2% |
| Czechoslovakians | 22.4 /100 | #197 | Fair 4.2% |
| Immigrants | Middle Africa | 22.1 /100 | #198 | Fair 4.2% |
| Norwegians | 20.5 /100 | #199 | Fair 4.2% |
| Immigrants | North Macedonia | 20.2 /100 | #200 | Fair 4.2% |
| Finns | 18.7 /100 | #201 | Poor 4.2% |
| Immigrants | Iraq | 17.1 /100 | #202 | Poor 4.2% |
| Panamanians | 15.9 /100 | #203 | Poor 4.1% |
Demographics Similar to Immigrants from Nepal by Professional Degree
In terms of professional degree, the demographic groups most similar to Immigrants from Nepal are Icelander (4.8%, a difference of 0.030%), Palestinian (4.8%, a difference of 0.050%), Pakistani (4.8%, a difference of 0.22%), Italian (4.8%, a difference of 0.48%), and Immigrants from Eastern Africa (4.8%, a difference of 0.51%).
| Demographics | Rating | Rank | Professional Degree |
| Immigrants | Eritrea | 93.5 /100 | #124 | Exceptional 4.8% |
| Immigrants | Albania | 93.3 /100 | #125 | Exceptional 4.8% |
| Europeans | 93.2 /100 | #126 | Exceptional 4.8% |
| Serbians | 92.6 /100 | #127 | Exceptional 4.8% |
| Immigrants | Eastern Africa | 92.5 /100 | #128 | Exceptional 4.8% |
| Palestinians | 91.5 /100 | #129 | Exceptional 4.8% |
| Icelanders | 91.5 /100 | #130 | Exceptional 4.8% |
| Immigrants | Nepal | 91.4 /100 | #131 | Exceptional 4.8% |
| Pakistanis | 90.9 /100 | #132 | Exceptional 4.8% |
| Italians | 90.2 /100 | #133 | Exceptional 4.8% |
| South American Indians | 89.9 /100 | #134 | Excellent 4.8% |
| Macedonians | 89.8 /100 | #135 | Excellent 4.8% |
| Immigrants | Jordan | 89.0 /100 | #136 | Excellent 4.7% |
| Jordanians | 88.9 /100 | #137 | Excellent 4.7% |
| Afghans | 88.8 /100 | #138 | Excellent 4.7% |