Zimbabwean vs Immigrants from Nepal In Labor Force | Age 35-44
COMPARE
Zimbabwean
Immigrants from Nepal
In Labor Force | Age 35-44
In Labor Force | Age 35-44 Comparison
Zimbabweans
Immigrants from Nepal
86.1%
IN LABOR FORCE | AGE 35-44
100.0/ 100
METRIC RATING
5th/ 347
METRIC RANK
85.3%
IN LABOR FORCE | AGE 35-44
99.9/ 100
METRIC RATING
34th/ 347
METRIC RANK
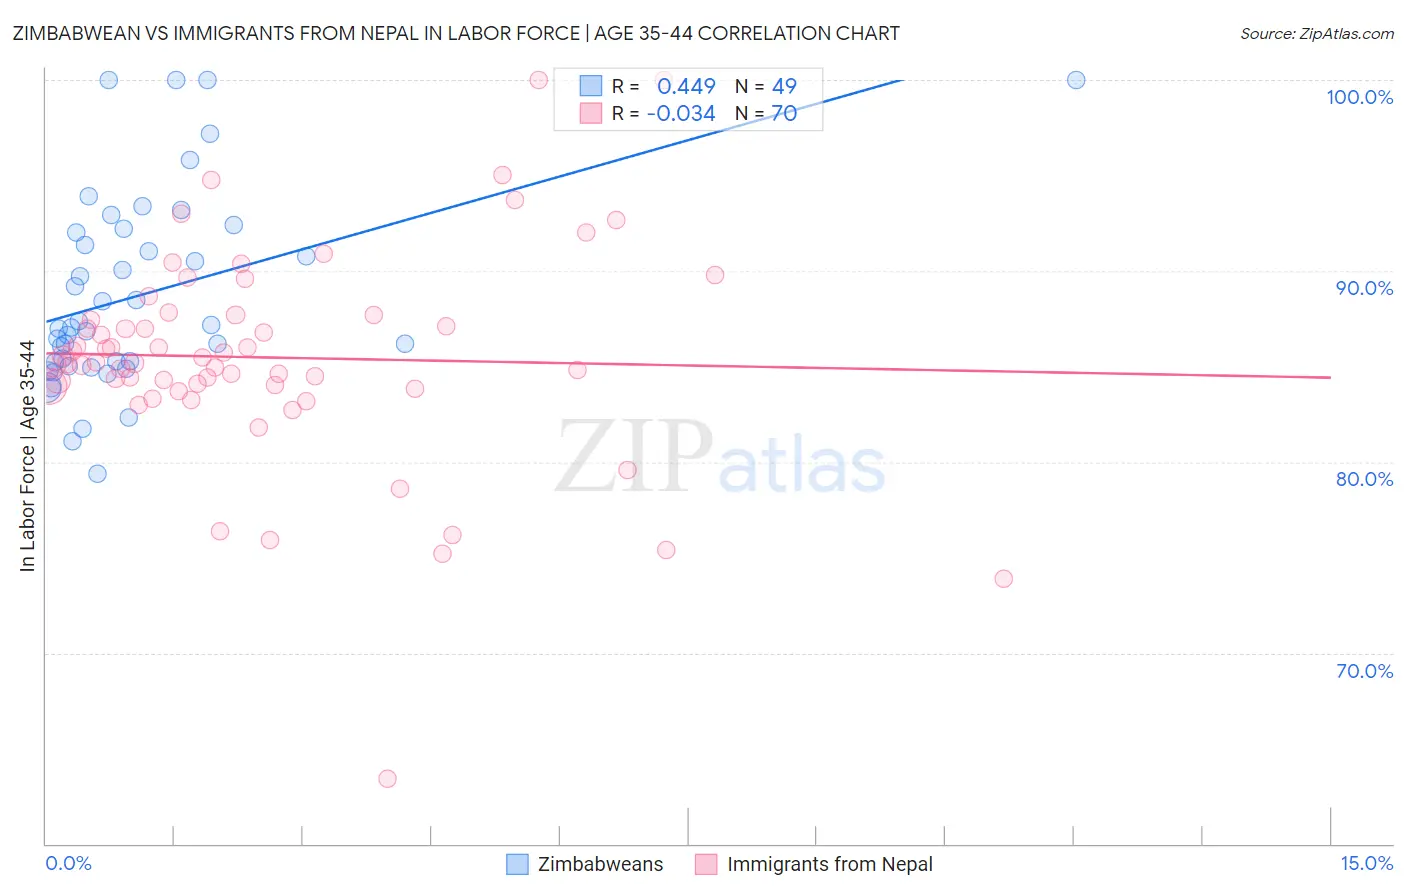
Zimbabwean vs Immigrants from Nepal In Labor Force | Age 35-44 Correlation Chart
The statistical analysis conducted on geographies consisting of 69,188,231 people shows a moderate positive correlation between the proportion of Zimbabweans and labor force participation rate among population between the ages 35 and 44 in the United States with a correlation coefficient (R) of 0.449 and weighted average of 86.1%. Similarly, the statistical analysis conducted on geographies consisting of 186,726,251 people shows no correlation between the proportion of Immigrants from Nepal and labor force participation rate among population between the ages 35 and 44 in the United States with a correlation coefficient (R) of -0.034 and weighted average of 85.3%, a difference of 0.96%.
In Labor Force | Age 35-44 Correlation Summary
| Measurement | Zimbabwean | Immigrants from Nepal |
| Minimum | 79.4% | 63.4% |
| Maximum | 100.0% | 100.0% |
| Range | 20.6% | 36.6% |
| Mean | 88.7% | 85.5% |
| Median | 87.0% | 85.2% |
| Interquartile 25% (IQ1) | 85.1% | 83.9% |
| Interquartile 75% (IQ3) | 92.1% | 87.7% |
| Interquartile Range (IQR) | 7.0% | 3.8% |
| Standard Deviation (Sample) | 5.1% | 5.7% |
| Standard Deviation (Population) | 5.0% | 5.6% |
Similar Demographics by In Labor Force | Age 35-44
Demographics Similar to Zimbabweans by In Labor Force | Age 35-44
In terms of in labor force | age 35-44, the demographic groups most similar to Zimbabweans are Bolivian (86.1%, a difference of 0.010%), Immigrants from Sierra Leone (86.1%, a difference of 0.050%), Immigrants from Cabo Verde (86.2%, a difference of 0.13%), Immigrants from Bolivia (86.2%, a difference of 0.16%), and Immigrants from Ethiopia (85.9%, a difference of 0.22%).
| Demographics | Rating | Rank | In Labor Force | Age 35-44 |
| Sierra Leoneans | 100.0 /100 | #1 | Exceptional 86.4% |
| Luxembourgers | 100.0 /100 | #2 | Exceptional 86.4% |
| Immigrants | Bolivia | 100.0 /100 | #3 | Exceptional 86.2% |
| Immigrants | Cabo Verde | 100.0 /100 | #4 | Exceptional 86.2% |
| Zimbabweans | 100.0 /100 | #5 | Exceptional 86.1% |
| Bolivians | 100.0 /100 | #6 | Exceptional 86.1% |
| Immigrants | Sierra Leone | 100.0 /100 | #7 | Exceptional 86.1% |
| Immigrants | Ethiopia | 100.0 /100 | #8 | Exceptional 85.9% |
| Ethiopians | 100.0 /100 | #9 | Exceptional 85.9% |
| Cape Verdeans | 100.0 /100 | #10 | Exceptional 85.8% |
| Immigrants | Cameroon | 100.0 /100 | #11 | Exceptional 85.8% |
| Liberians | 100.0 /100 | #12 | Exceptional 85.7% |
| Somalis | 100.0 /100 | #13 | Exceptional 85.6% |
| Immigrants | Somalia | 100.0 /100 | #14 | Exceptional 85.6% |
| Norwegians | 100.0 /100 | #15 | Exceptional 85.6% |
Demographics Similar to Immigrants from Nepal by In Labor Force | Age 35-44
In terms of in labor force | age 35-44, the demographic groups most similar to Immigrants from Nepal are Estonian (85.3%, a difference of 0.0%), Ugandan (85.3%, a difference of 0.020%), Czech (85.3%, a difference of 0.030%), Immigrants from India (85.3%, a difference of 0.030%), and Immigrants from Morocco (85.2%, a difference of 0.030%).
| Demographics | Rating | Rank | In Labor Force | Age 35-44 |
| Immigrants | Lithuania | 99.9 /100 | #27 | Exceptional 85.4% |
| Immigrants | Greece | 99.9 /100 | #28 | Exceptional 85.3% |
| Cambodians | 99.9 /100 | #29 | Exceptional 85.3% |
| Bermudans | 99.9 /100 | #30 | Exceptional 85.3% |
| Czechs | 99.9 /100 | #31 | Exceptional 85.3% |
| Immigrants | India | 99.9 /100 | #32 | Exceptional 85.3% |
| Ugandans | 99.9 /100 | #33 | Exceptional 85.3% |
| Immigrants | Nepal | 99.9 /100 | #34 | Exceptional 85.3% |
| Estonians | 99.9 /100 | #35 | Exceptional 85.3% |
| Immigrants | Morocco | 99.8 /100 | #36 | Exceptional 85.2% |
| Kenyans | 99.8 /100 | #37 | Exceptional 85.2% |
| Immigrants | Poland | 99.8 /100 | #38 | Exceptional 85.2% |
| Eastern Europeans | 99.8 /100 | #39 | Exceptional 85.2% |
| Immigrants | Bulgaria | 99.8 /100 | #40 | Exceptional 85.2% |
| Immigrants | Zimbabwe | 99.8 /100 | #41 | Exceptional 85.2% |