Spanish American Indian vs Welsh In Labor Force | Age 20-64
COMPARE
Spanish American Indian
Welsh
In Labor Force | Age 20-64
In Labor Force | Age 20-64 Comparison
Spanish American Indians
Welsh
77.6%
IN LABOR FORCE | AGE 20-64
0.0/ 100
METRIC RATING
300th/ 347
METRIC RANK
79.0%
IN LABOR FORCE | AGE 20-64
2.4/ 100
METRIC RATING
239th/ 347
METRIC RANK
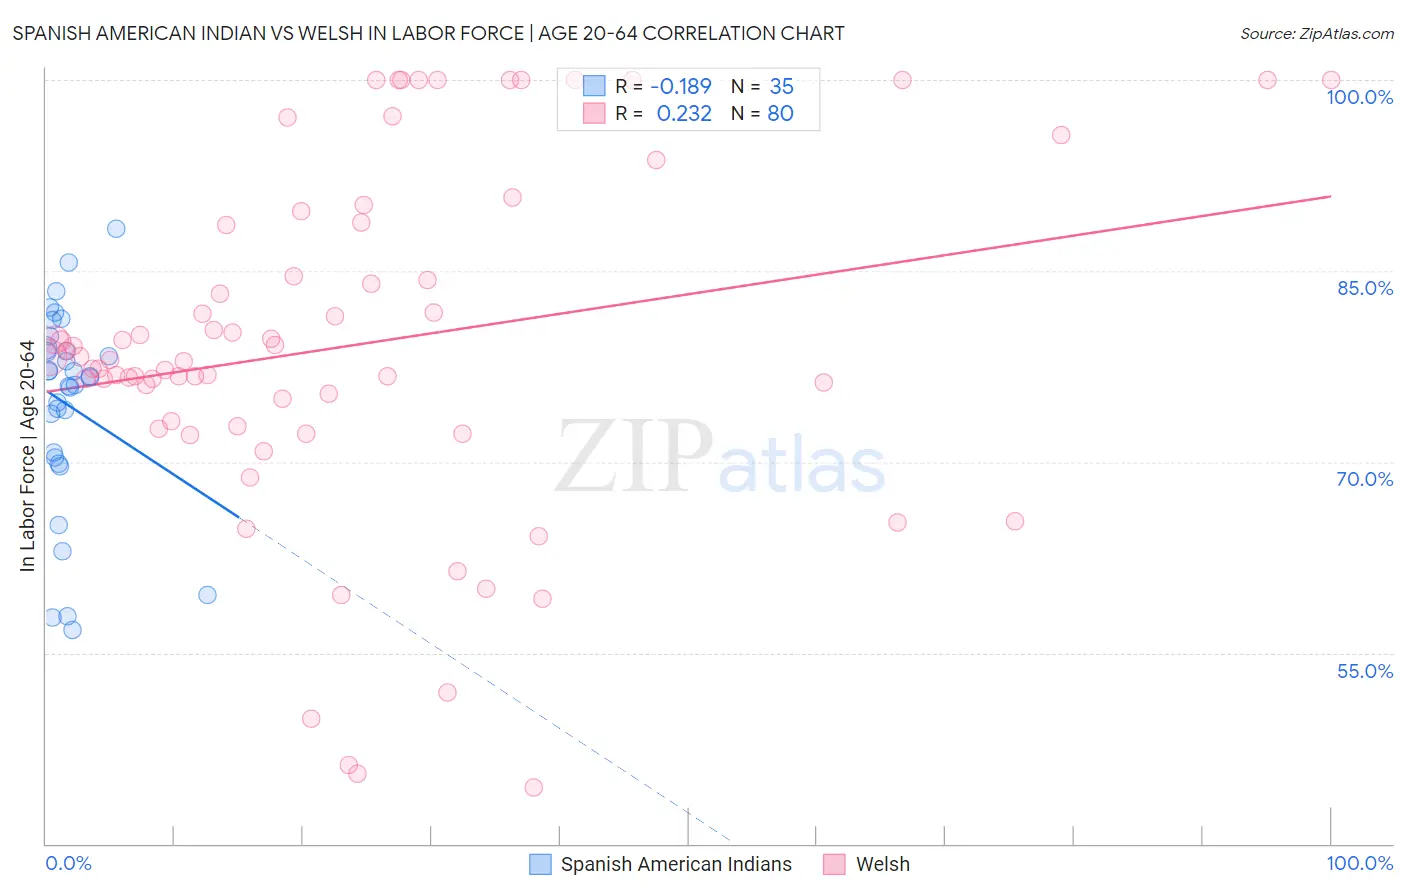
Spanish American Indian vs Welsh In Labor Force | Age 20-64 Correlation Chart
The statistical analysis conducted on geographies consisting of 73,150,359 people shows a poor negative correlation between the proportion of Spanish American Indians and labor force participation rate among population between the ages 20 and 64 in the United States with a correlation coefficient (R) of -0.189 and weighted average of 77.6%. Similarly, the statistical analysis conducted on geographies consisting of 528,606,062 people shows a weak positive correlation between the proportion of Welsh and labor force participation rate among population between the ages 20 and 64 in the United States with a correlation coefficient (R) of 0.232 and weighted average of 79.0%, a difference of 1.8%.
In Labor Force | Age 20-64 Correlation Summary
| Measurement | Spanish American Indian | Welsh |
| Minimum | 56.8% | 44.4% |
| Maximum | 88.3% | 100.0% |
| Range | 31.5% | 55.6% |
| Mean | 74.4% | 79.2% |
| Median | 76.6% | 78.1% |
| Interquartile 25% (IQ1) | 70.3% | 73.0% |
| Interquartile 75% (IQ3) | 79.0% | 88.7% |
| Interquartile Range (IQR) | 8.7% | 15.7% |
| Standard Deviation (Sample) | 7.9% | 13.7% |
| Standard Deviation (Population) | 7.8% | 13.6% |
Similar Demographics by In Labor Force | Age 20-64
Demographics Similar to Spanish American Indians by In Labor Force | Age 20-64
In terms of in labor force | age 20-64, the demographic groups most similar to Spanish American Indians are Nepalese (77.5%, a difference of 0.040%), Hispanic or Latino (77.6%, a difference of 0.070%), Iroquois (77.5%, a difference of 0.090%), Dominican (77.7%, a difference of 0.13%), and Cree (77.7%, a difference of 0.13%).
| Demographics | Rating | Rank | In Labor Force | Age 20-64 |
| Delaware | 0.0 /100 | #293 | Tragic 77.8% |
| Immigrants | Central America | 0.0 /100 | #294 | Tragic 77.7% |
| Immigrants | Grenada | 0.0 /100 | #295 | Tragic 77.7% |
| Immigrants | Dominican Republic | 0.0 /100 | #296 | Tragic 77.7% |
| Dominicans | 0.0 /100 | #297 | Tragic 77.7% |
| Cree | 0.0 /100 | #298 | Tragic 77.7% |
| Hispanics or Latinos | 0.0 /100 | #299 | Tragic 77.6% |
| Spanish American Indians | 0.0 /100 | #300 | Tragic 77.6% |
| Nepalese | 0.0 /100 | #301 | Tragic 77.5% |
| Iroquois | 0.0 /100 | #302 | Tragic 77.5% |
| Chippewa | 0.0 /100 | #303 | Tragic 77.3% |
| Immigrants | Mexico | 0.0 /100 | #304 | Tragic 77.3% |
| Mexicans | 0.0 /100 | #305 | Tragic 77.2% |
| Potawatomi | 0.0 /100 | #306 | Tragic 77.2% |
| Central American Indians | 0.0 /100 | #307 | Tragic 77.1% |
Demographics Similar to Welsh by In Labor Force | Age 20-64
In terms of in labor force | age 20-64, the demographic groups most similar to Welsh are Trinidadian and Tobagonian (79.0%, a difference of 0.010%), Immigrants from Jamaica (79.0%, a difference of 0.020%), Samoan (79.0%, a difference of 0.040%), Immigrants from North America (79.0%, a difference of 0.040%), and Jamaican (78.9%, a difference of 0.040%).
| Demographics | Rating | Rank | In Labor Force | Age 20-64 |
| Guamanians/Chamorros | 4.5 /100 | #232 | Tragic 79.1% |
| Japanese | 4.0 /100 | #233 | Tragic 79.1% |
| Immigrants | Canada | 3.2 /100 | #234 | Tragic 79.0% |
| Tlingit-Haida | 3.2 /100 | #235 | Tragic 79.0% |
| Samoans | 2.9 /100 | #236 | Tragic 79.0% |
| Immigrants | North America | 2.9 /100 | #237 | Tragic 79.0% |
| Immigrants | Jamaica | 2.6 /100 | #238 | Tragic 79.0% |
| Welsh | 2.4 /100 | #239 | Tragic 79.0% |
| Trinidadians and Tobagonians | 2.3 /100 | #240 | Tragic 79.0% |
| Jamaicans | 2.0 /100 | #241 | Tragic 78.9% |
| Immigrants | Micronesia | 1.9 /100 | #242 | Tragic 78.9% |
| Immigrants | West Indies | 1.7 /100 | #243 | Tragic 78.9% |
| French | 1.5 /100 | #244 | Tragic 78.9% |
| Scottish | 1.3 /100 | #245 | Tragic 78.9% |
| Immigrants | Trinidad and Tobago | 1.1 /100 | #246 | Tragic 78.8% |