Spanish American Indian vs Immigrants from Kenya In Labor Force | Age 20-64
COMPARE
Spanish American Indian
Immigrants from Kenya
In Labor Force | Age 20-64
In Labor Force | Age 20-64 Comparison
Spanish American Indians
Immigrants from Kenya
77.6%
IN LABOR FORCE | AGE 20-64
0.0/ 100
METRIC RATING
300th/ 347
METRIC RANK
80.7%
IN LABOR FORCE | AGE 20-64
99.9/ 100
METRIC RATING
27th/ 347
METRIC RANK
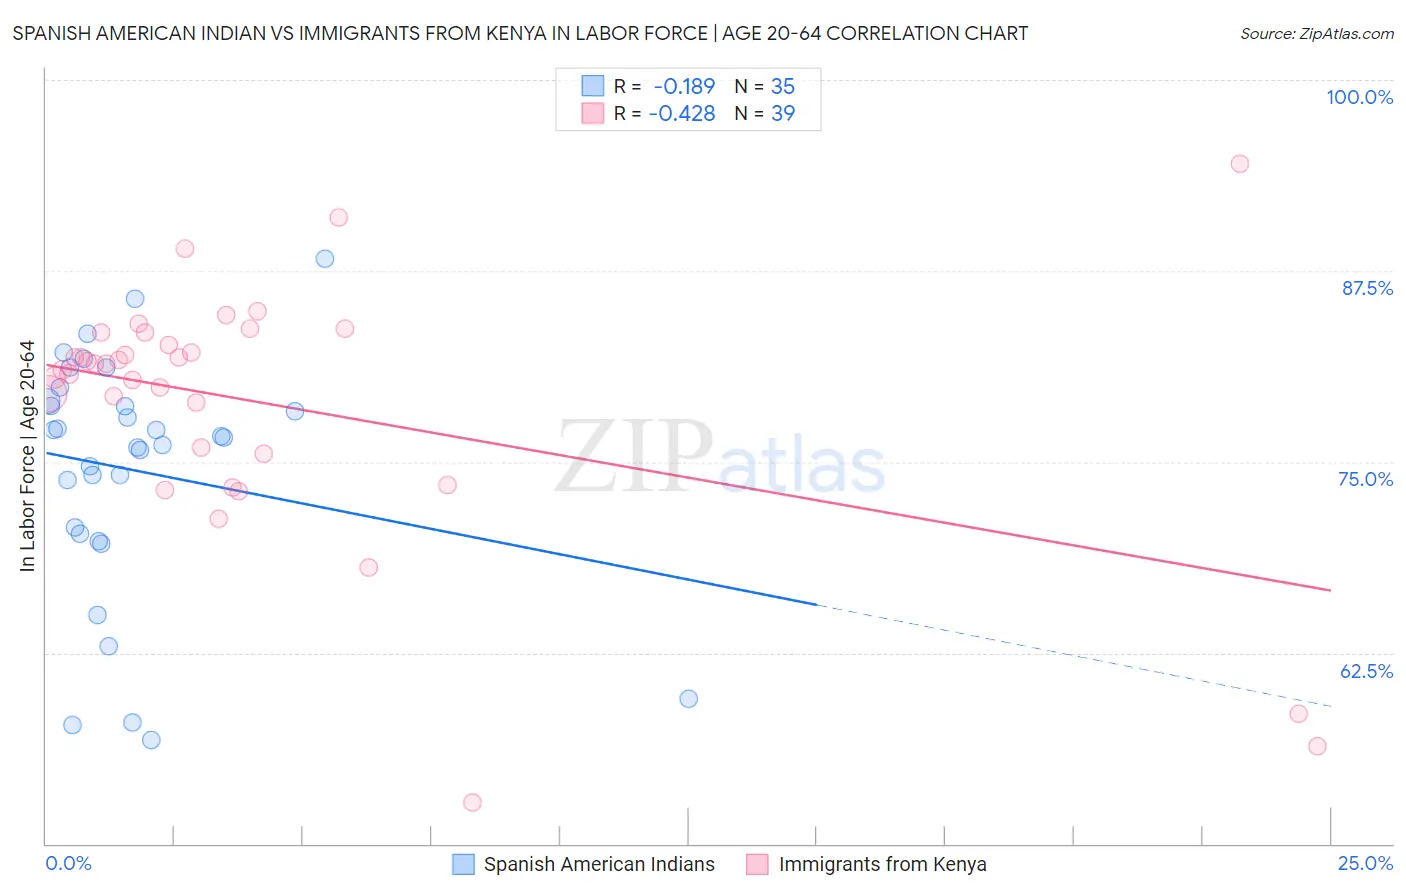
Spanish American Indian vs Immigrants from Kenya In Labor Force | Age 20-64 Correlation Chart
The statistical analysis conducted on geographies consisting of 73,150,359 people shows a poor negative correlation between the proportion of Spanish American Indians and labor force participation rate among population between the ages 20 and 64 in the United States with a correlation coefficient (R) of -0.189 and weighted average of 77.6%. Similarly, the statistical analysis conducted on geographies consisting of 218,088,200 people shows a moderate negative correlation between the proportion of Immigrants from Kenya and labor force participation rate among population between the ages 20 and 64 in the United States with a correlation coefficient (R) of -0.428 and weighted average of 80.7%, a difference of 4.1%.
In Labor Force | Age 20-64 Correlation Summary
| Measurement | Spanish American Indian | Immigrants from Kenya |
| Minimum | 56.8% | 52.7% |
| Maximum | 88.3% | 94.5% |
| Range | 31.5% | 41.8% |
| Mean | 74.4% | 78.8% |
| Median | 76.6% | 81.4% |
| Interquartile 25% (IQ1) | 70.3% | 75.6% |
| Interquartile 75% (IQ3) | 79.0% | 83.4% |
| Interquartile Range (IQR) | 8.7% | 7.9% |
| Standard Deviation (Sample) | 7.9% | 8.4% |
| Standard Deviation (Population) | 7.8% | 8.3% |
Similar Demographics by In Labor Force | Age 20-64
Demographics Similar to Spanish American Indians by In Labor Force | Age 20-64
In terms of in labor force | age 20-64, the demographic groups most similar to Spanish American Indians are Nepalese (77.5%, a difference of 0.040%), Hispanic or Latino (77.6%, a difference of 0.070%), Iroquois (77.5%, a difference of 0.090%), Dominican (77.7%, a difference of 0.13%), and Cree (77.7%, a difference of 0.13%).
| Demographics | Rating | Rank | In Labor Force | Age 20-64 |
| Delaware | 0.0 /100 | #293 | Tragic 77.8% |
| Immigrants | Central America | 0.0 /100 | #294 | Tragic 77.7% |
| Immigrants | Grenada | 0.0 /100 | #295 | Tragic 77.7% |
| Immigrants | Dominican Republic | 0.0 /100 | #296 | Tragic 77.7% |
| Dominicans | 0.0 /100 | #297 | Tragic 77.7% |
| Cree | 0.0 /100 | #298 | Tragic 77.7% |
| Hispanics or Latinos | 0.0 /100 | #299 | Tragic 77.6% |
| Spanish American Indians | 0.0 /100 | #300 | Tragic 77.6% |
| Nepalese | 0.0 /100 | #301 | Tragic 77.5% |
| Iroquois | 0.0 /100 | #302 | Tragic 77.5% |
| Chippewa | 0.0 /100 | #303 | Tragic 77.3% |
| Immigrants | Mexico | 0.0 /100 | #304 | Tragic 77.3% |
| Mexicans | 0.0 /100 | #305 | Tragic 77.2% |
| Potawatomi | 0.0 /100 | #306 | Tragic 77.2% |
| Central American Indians | 0.0 /100 | #307 | Tragic 77.1% |
Demographics Similar to Immigrants from Kenya by In Labor Force | Age 20-64
In terms of in labor force | age 20-64, the demographic groups most similar to Immigrants from Kenya are Immigrants from Uganda (80.7%, a difference of 0.010%), Immigrants from South Central Asia (80.7%, a difference of 0.030%), Immigrants from North Macedonia (80.7%, a difference of 0.030%), Immigrants from Lithuania (80.7%, a difference of 0.050%), and Immigrants from Ireland (80.7%, a difference of 0.060%).
| Demographics | Rating | Rank | In Labor Force | Age 20-64 |
| Thais | 100.0 /100 | #20 | Exceptional 80.9% |
| Liberians | 100.0 /100 | #21 | Exceptional 80.9% |
| Sudanese | 100.0 /100 | #22 | Exceptional 80.8% |
| Immigrants | Bosnia and Herzegovina | 100.0 /100 | #23 | Exceptional 80.8% |
| Immigrants | Morocco | 100.0 /100 | #24 | Exceptional 80.8% |
| Kenyans | 100.0 /100 | #25 | Exceptional 80.8% |
| Immigrants | Serbia | 100.0 /100 | #26 | Exceptional 80.8% |
| Immigrants | Kenya | 99.9 /100 | #27 | Exceptional 80.7% |
| Immigrants | Uganda | 99.9 /100 | #28 | Exceptional 80.7% |
| Immigrants | South Central Asia | 99.9 /100 | #29 | Exceptional 80.7% |
| Immigrants | North Macedonia | 99.9 /100 | #30 | Exceptional 80.7% |
| Immigrants | Lithuania | 99.9 /100 | #31 | Exceptional 80.7% |
| Immigrants | Ireland | 99.9 /100 | #32 | Exceptional 80.7% |
| Chinese | 99.9 /100 | #33 | Exceptional 80.7% |
| Immigrants | Brazil | 99.9 /100 | #34 | Exceptional 80.7% |