Spanish American Indian vs Carpatho Rusyn In Labor Force | Age 20-64
COMPARE
Spanish American Indian
Carpatho Rusyn
In Labor Force | Age 20-64
In Labor Force | Age 20-64 Comparison
Spanish American Indians
Carpatho Rusyns
77.6%
IN LABOR FORCE | AGE 20-64
0.0/ 100
METRIC RATING
300th/ 347
METRIC RANK
80.3%
IN LABOR FORCE | AGE 20-64
98.8/ 100
METRIC RATING
62nd/ 347
METRIC RANK
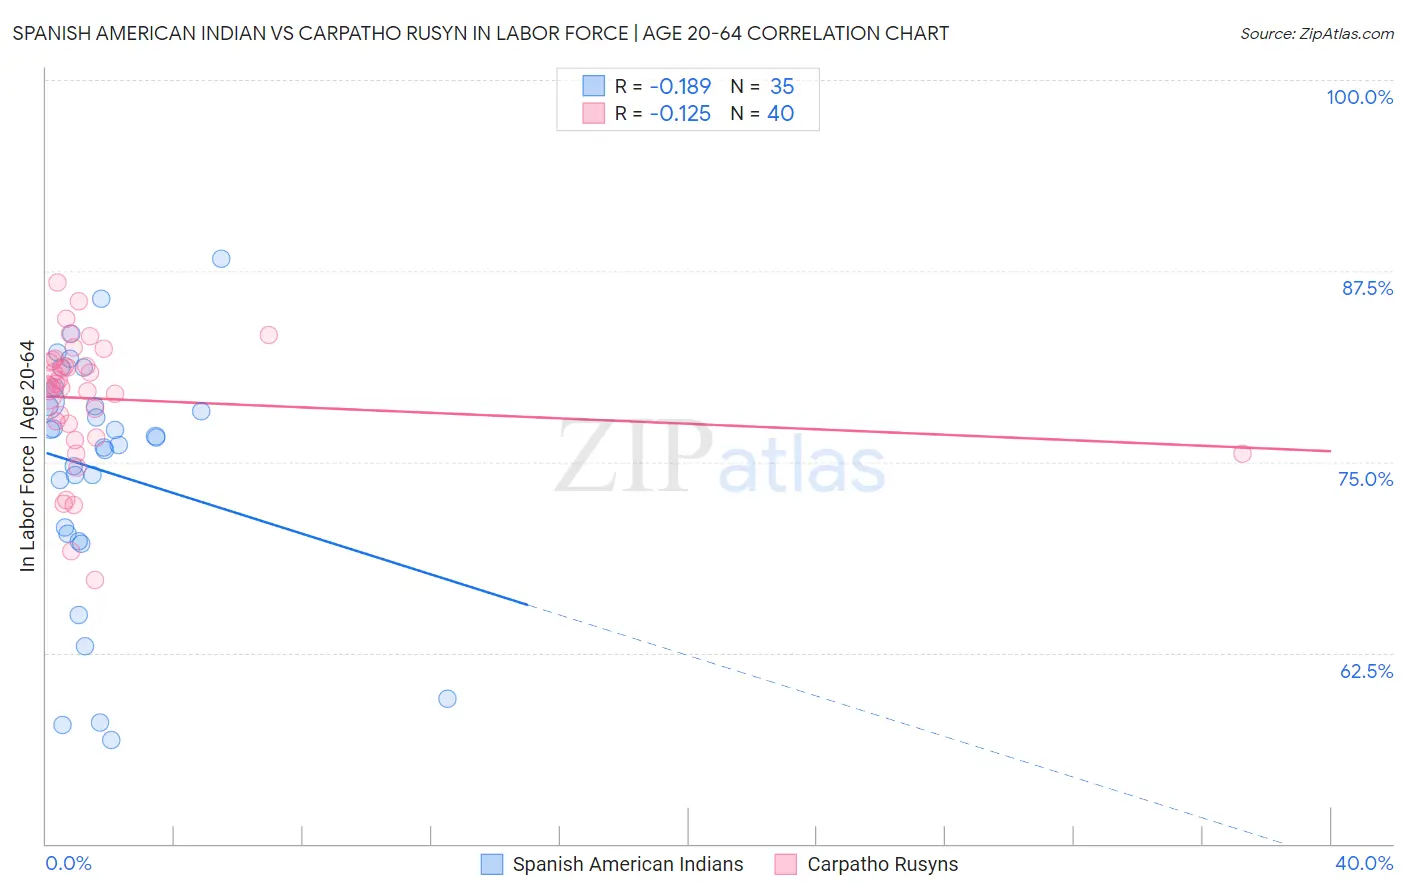
Spanish American Indian vs Carpatho Rusyn In Labor Force | Age 20-64 Correlation Chart
The statistical analysis conducted on geographies consisting of 73,150,359 people shows a poor negative correlation between the proportion of Spanish American Indians and labor force participation rate among population between the ages 20 and 64 in the United States with a correlation coefficient (R) of -0.189 and weighted average of 77.6%. Similarly, the statistical analysis conducted on geographies consisting of 58,872,065 people shows a poor negative correlation between the proportion of Carpatho Rusyns and labor force participation rate among population between the ages 20 and 64 in the United States with a correlation coefficient (R) of -0.125 and weighted average of 80.3%, a difference of 3.5%.
In Labor Force | Age 20-64 Correlation Summary
| Measurement | Spanish American Indian | Carpatho Rusyn |
| Minimum | 56.8% | 67.3% |
| Maximum | 88.3% | 86.8% |
| Range | 31.5% | 19.5% |
| Mean | 74.4% | 79.1% |
| Median | 76.6% | 80.0% |
| Interquartile 25% (IQ1) | 70.3% | 77.0% |
| Interquartile 75% (IQ3) | 79.0% | 81.6% |
| Interquartile Range (IQR) | 8.7% | 4.5% |
| Standard Deviation (Sample) | 7.9% | 4.2% |
| Standard Deviation (Population) | 7.8% | 4.2% |
Similar Demographics by In Labor Force | Age 20-64
Demographics Similar to Spanish American Indians by In Labor Force | Age 20-64
In terms of in labor force | age 20-64, the demographic groups most similar to Spanish American Indians are Nepalese (77.5%, a difference of 0.040%), Hispanic or Latino (77.6%, a difference of 0.070%), Iroquois (77.5%, a difference of 0.090%), Dominican (77.7%, a difference of 0.13%), and Cree (77.7%, a difference of 0.13%).
| Demographics | Rating | Rank | In Labor Force | Age 20-64 |
| Delaware | 0.0 /100 | #293 | Tragic 77.8% |
| Immigrants | Central America | 0.0 /100 | #294 | Tragic 77.7% |
| Immigrants | Grenada | 0.0 /100 | #295 | Tragic 77.7% |
| Immigrants | Dominican Republic | 0.0 /100 | #296 | Tragic 77.7% |
| Dominicans | 0.0 /100 | #297 | Tragic 77.7% |
| Cree | 0.0 /100 | #298 | Tragic 77.7% |
| Hispanics or Latinos | 0.0 /100 | #299 | Tragic 77.6% |
| Spanish American Indians | 0.0 /100 | #300 | Tragic 77.6% |
| Nepalese | 0.0 /100 | #301 | Tragic 77.5% |
| Iroquois | 0.0 /100 | #302 | Tragic 77.5% |
| Chippewa | 0.0 /100 | #303 | Tragic 77.3% |
| Immigrants | Mexico | 0.0 /100 | #304 | Tragic 77.3% |
| Mexicans | 0.0 /100 | #305 | Tragic 77.2% |
| Potawatomi | 0.0 /100 | #306 | Tragic 77.2% |
| Central American Indians | 0.0 /100 | #307 | Tragic 77.1% |
Demographics Similar to Carpatho Rusyns by In Labor Force | Age 20-64
In terms of in labor force | age 20-64, the demographic groups most similar to Carpatho Rusyns are Tongan (80.3%, a difference of 0.0%), Burmese (80.3%, a difference of 0.0%), Serbian (80.3%, a difference of 0.010%), Swedish (80.3%, a difference of 0.010%), and Immigrants from Korea (80.3%, a difference of 0.010%).
| Demographics | Rating | Rank | In Labor Force | Age 20-64 |
| Immigrants | Cabo Verde | 99.0 /100 | #55 | Exceptional 80.3% |
| Immigrants | Northern Africa | 99.0 /100 | #56 | Exceptional 80.3% |
| Afghans | 98.9 /100 | #57 | Exceptional 80.3% |
| Serbians | 98.9 /100 | #58 | Exceptional 80.3% |
| Swedes | 98.9 /100 | #59 | Exceptional 80.3% |
| Tongans | 98.8 /100 | #60 | Exceptional 80.3% |
| Burmese | 98.8 /100 | #61 | Exceptional 80.3% |
| Carpatho Rusyns | 98.8 /100 | #62 | Exceptional 80.3% |
| Immigrants | Korea | 98.8 /100 | #63 | Exceptional 80.3% |
| Immigrants | Albania | 98.7 /100 | #64 | Exceptional 80.3% |
| Lithuanians | 98.7 /100 | #65 | Exceptional 80.2% |
| Macedonians | 98.7 /100 | #66 | Exceptional 80.2% |
| Taiwanese | 98.6 /100 | #67 | Exceptional 80.2% |
| Bhutanese | 98.6 /100 | #68 | Exceptional 80.2% |
| Albanians | 98.6 /100 | #69 | Exceptional 80.2% |