Iraqi vs Welsh In Labor Force | Age 20-64
COMPARE
Iraqi
Welsh
In Labor Force | Age 20-64
In Labor Force | Age 20-64 Comparison
Iraqis
Welsh
79.3%
IN LABOR FORCE | AGE 20-64
17.7/ 100
METRIC RATING
203rd/ 347
METRIC RANK
79.0%
IN LABOR FORCE | AGE 20-64
2.4/ 100
METRIC RATING
239th/ 347
METRIC RANK
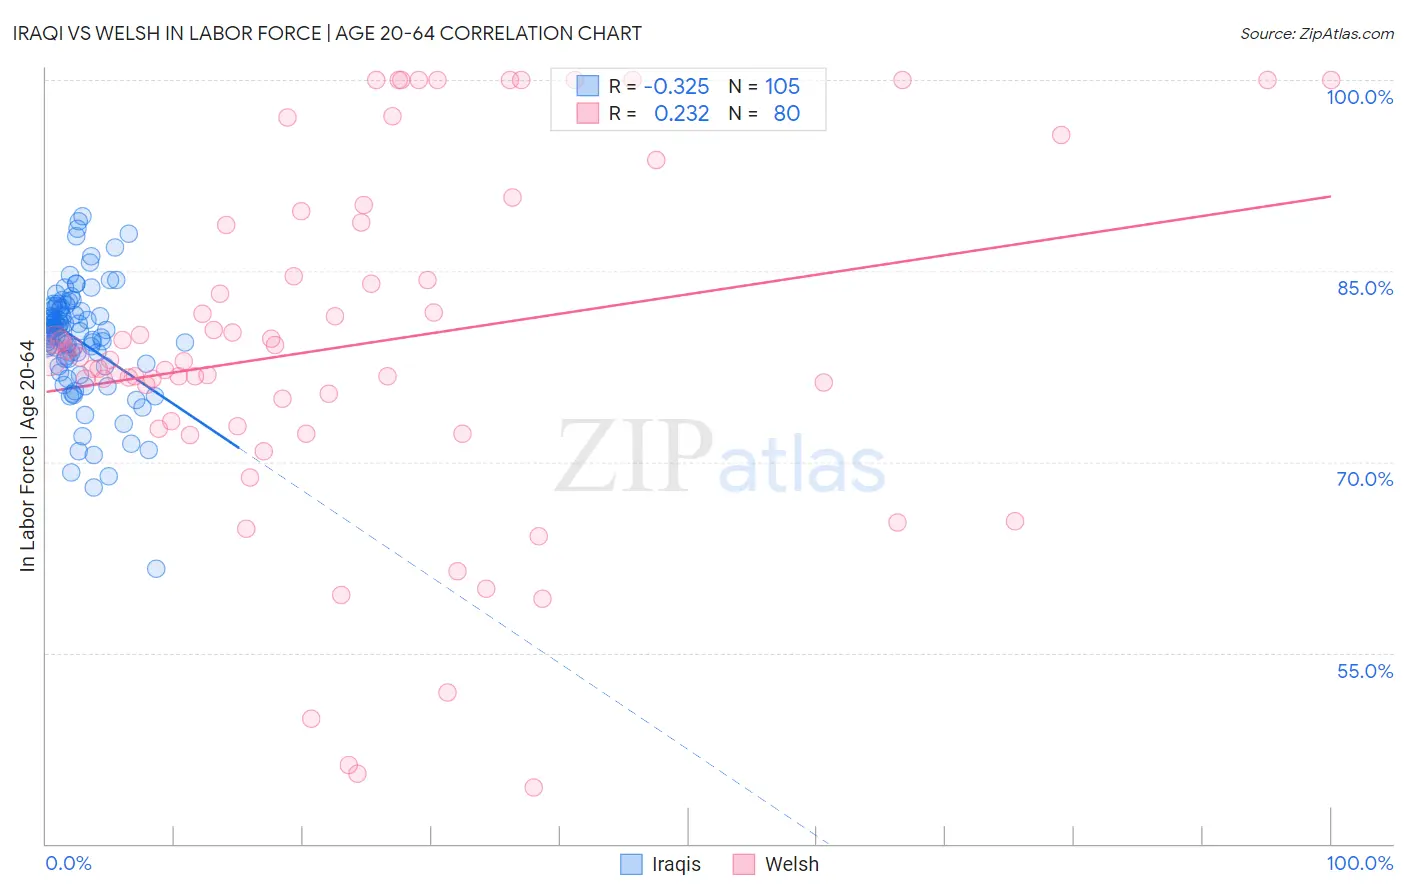
Iraqi vs Welsh In Labor Force | Age 20-64 Correlation Chart
The statistical analysis conducted on geographies consisting of 170,648,723 people shows a mild negative correlation between the proportion of Iraqis and labor force participation rate among population between the ages 20 and 64 in the United States with a correlation coefficient (R) of -0.325 and weighted average of 79.3%. Similarly, the statistical analysis conducted on geographies consisting of 528,606,062 people shows a weak positive correlation between the proportion of Welsh and labor force participation rate among population between the ages 20 and 64 in the United States with a correlation coefficient (R) of 0.232 and weighted average of 79.0%, a difference of 0.44%.
In Labor Force | Age 20-64 Correlation Summary
| Measurement | Iraqi | Welsh |
| Minimum | 61.6% | 44.4% |
| Maximum | 89.3% | 100.0% |
| Range | 27.7% | 55.6% |
| Mean | 79.6% | 79.2% |
| Median | 80.3% | 78.1% |
| Interquartile 25% (IQ1) | 77.6% | 73.0% |
| Interquartile 75% (IQ3) | 82.1% | 88.7% |
| Interquartile Range (IQR) | 4.5% | 15.7% |
| Standard Deviation (Sample) | 4.6% | 13.7% |
| Standard Deviation (Population) | 4.6% | 13.6% |
Similar Demographics by In Labor Force | Age 20-64
Demographics Similar to Iraqis by In Labor Force | Age 20-64
In terms of in labor force | age 20-64, the demographic groups most similar to Iraqis are Immigrants from Cambodia (79.3%, a difference of 0.0%), Immigrants from Congo (79.3%, a difference of 0.0%), Nicaraguan (79.3%, a difference of 0.010%), Immigrants from Ecuador (79.3%, a difference of 0.010%), and Immigrants from Oceania (79.3%, a difference of 0.020%).
| Demographics | Rating | Rank | In Labor Force | Age 20-64 |
| Ecuadorians | 23.1 /100 | #196 | Fair 79.4% |
| Immigrants | Senegal | 22.5 /100 | #197 | Fair 79.4% |
| Immigrants | Laos | 21.5 /100 | #198 | Fair 79.4% |
| Dutch | 20.2 /100 | #199 | Fair 79.3% |
| Immigrants | Oceania | 19.1 /100 | #200 | Poor 79.3% |
| Immigrants | Nicaragua | 19.0 /100 | #201 | Poor 79.3% |
| Nicaraguans | 18.3 /100 | #202 | Poor 79.3% |
| Iraqis | 17.7 /100 | #203 | Poor 79.3% |
| Immigrants | Cambodia | 17.6 /100 | #204 | Poor 79.3% |
| Immigrants | Congo | 17.5 /100 | #205 | Poor 79.3% |
| Immigrants | Ecuador | 16.9 /100 | #206 | Poor 79.3% |
| Sub-Saharan Africans | 16.5 /100 | #207 | Poor 79.3% |
| British | 16.5 /100 | #208 | Poor 79.3% |
| Bangladeshis | 16.4 /100 | #209 | Poor 79.3% |
| Haitians | 16.1 /100 | #210 | Poor 79.3% |
Demographics Similar to Welsh by In Labor Force | Age 20-64
In terms of in labor force | age 20-64, the demographic groups most similar to Welsh are Trinidadian and Tobagonian (79.0%, a difference of 0.010%), Immigrants from Jamaica (79.0%, a difference of 0.020%), Samoan (79.0%, a difference of 0.040%), Immigrants from North America (79.0%, a difference of 0.040%), and Jamaican (78.9%, a difference of 0.040%).
| Demographics | Rating | Rank | In Labor Force | Age 20-64 |
| Guamanians/Chamorros | 4.5 /100 | #232 | Tragic 79.1% |
| Japanese | 4.0 /100 | #233 | Tragic 79.1% |
| Immigrants | Canada | 3.2 /100 | #234 | Tragic 79.0% |
| Tlingit-Haida | 3.2 /100 | #235 | Tragic 79.0% |
| Samoans | 2.9 /100 | #236 | Tragic 79.0% |
| Immigrants | North America | 2.9 /100 | #237 | Tragic 79.0% |
| Immigrants | Jamaica | 2.6 /100 | #238 | Tragic 79.0% |
| Welsh | 2.4 /100 | #239 | Tragic 79.0% |
| Trinidadians and Tobagonians | 2.3 /100 | #240 | Tragic 79.0% |
| Jamaicans | 2.0 /100 | #241 | Tragic 78.9% |
| Immigrants | Micronesia | 1.9 /100 | #242 | Tragic 78.9% |
| Immigrants | West Indies | 1.7 /100 | #243 | Tragic 78.9% |
| French | 1.5 /100 | #244 | Tragic 78.9% |
| Scottish | 1.3 /100 | #245 | Tragic 78.9% |
| Immigrants | Trinidad and Tobago | 1.1 /100 | #246 | Tragic 78.8% |