Paiute vs Welsh In Labor Force | Age 20-64
COMPARE
Paiute
Welsh
In Labor Force | Age 20-64
In Labor Force | Age 20-64 Comparison
Paiute
Welsh
74.7%
IN LABOR FORCE | AGE 20-64
0.0/ 100
METRIC RATING
331st/ 347
METRIC RANK
79.0%
IN LABOR FORCE | AGE 20-64
2.4/ 100
METRIC RATING
239th/ 347
METRIC RANK
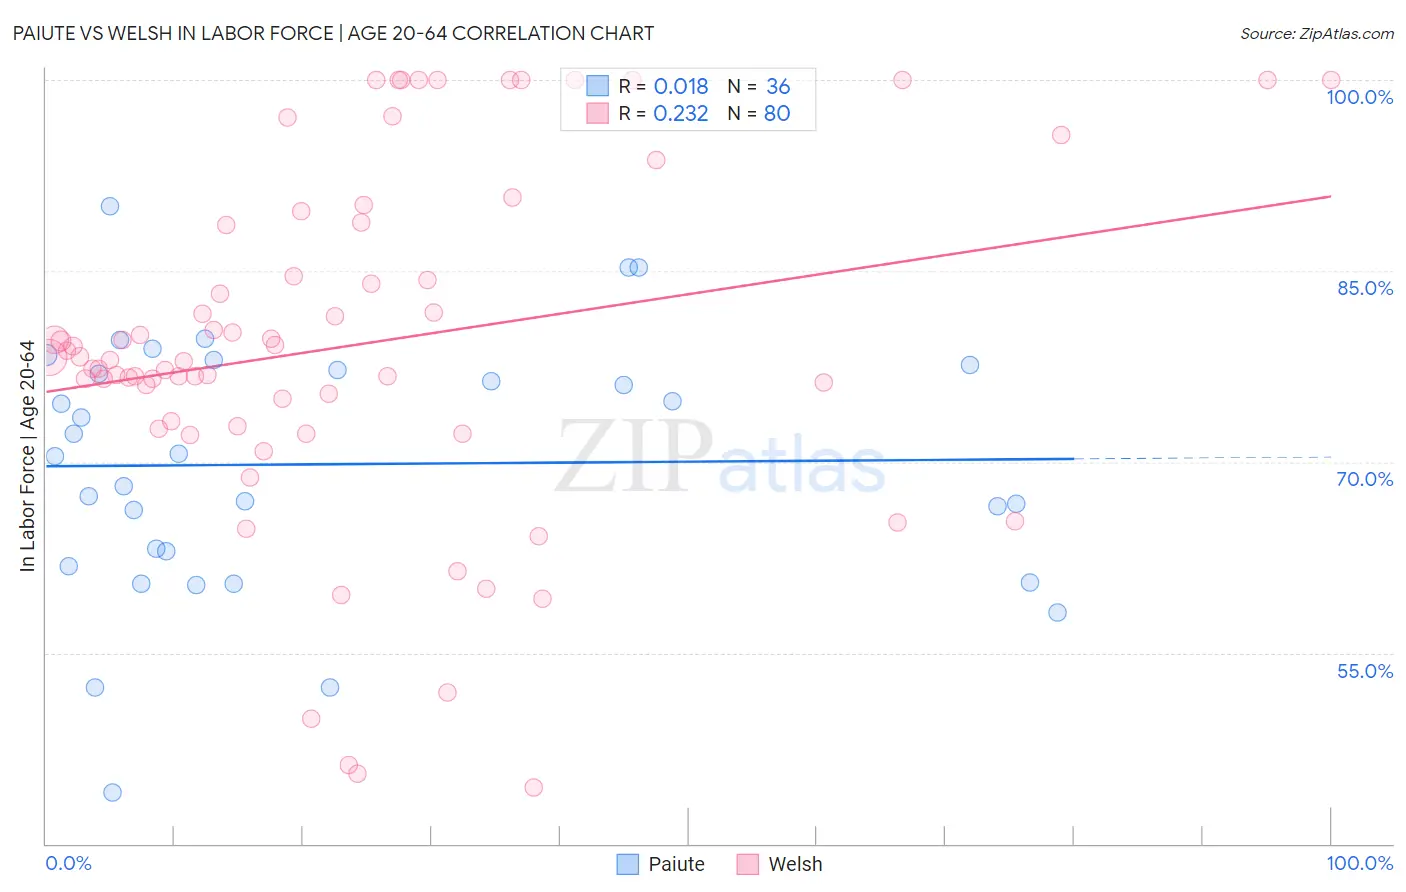
Paiute vs Welsh In Labor Force | Age 20-64 Correlation Chart
The statistical analysis conducted on geographies consisting of 58,399,197 people shows no correlation between the proportion of Paiute and labor force participation rate among population between the ages 20 and 64 in the United States with a correlation coefficient (R) of 0.018 and weighted average of 74.7%. Similarly, the statistical analysis conducted on geographies consisting of 528,606,062 people shows a weak positive correlation between the proportion of Welsh and labor force participation rate among population between the ages 20 and 64 in the United States with a correlation coefficient (R) of 0.232 and weighted average of 79.0%, a difference of 5.7%.
In Labor Force | Age 20-64 Correlation Summary
| Measurement | Paiute | Welsh |
| Minimum | 44.1% | 44.4% |
| Maximum | 90.1% | 100.0% |
| Range | 46.0% | 55.6% |
| Mean | 69.8% | 79.2% |
| Median | 70.5% | 78.1% |
| Interquartile 25% (IQ1) | 62.4% | 73.0% |
| Interquartile 75% (IQ3) | 77.4% | 88.7% |
| Interquartile Range (IQR) | 15.0% | 15.7% |
| Standard Deviation (Sample) | 10.1% | 13.7% |
| Standard Deviation (Population) | 10.0% | 13.6% |
Similar Demographics by In Labor Force | Age 20-64
Demographics Similar to Paiute by In Labor Force | Age 20-64
In terms of in labor force | age 20-64, the demographic groups most similar to Paiute are Colville (74.8%, a difference of 0.13%), Cheyenne (74.8%, a difference of 0.20%), Kiowa (75.0%, a difference of 0.40%), Arapaho (74.4%, a difference of 0.40%), and Sioux (75.0%, a difference of 0.43%).
| Demographics | Rating | Rank | In Labor Force | Age 20-64 |
| Choctaw | 0.0 /100 | #324 | Tragic 75.4% |
| Menominee | 0.0 /100 | #325 | Tragic 75.3% |
| Creek | 0.0 /100 | #326 | Tragic 75.1% |
| Sioux | 0.0 /100 | #327 | Tragic 75.0% |
| Kiowa | 0.0 /100 | #328 | Tragic 75.0% |
| Cheyenne | 0.0 /100 | #329 | Tragic 74.8% |
| Colville | 0.0 /100 | #330 | Tragic 74.8% |
| Paiute | 0.0 /100 | #331 | Tragic 74.7% |
| Arapaho | 0.0 /100 | #332 | Tragic 74.4% |
| Natives/Alaskans | 0.0 /100 | #333 | Tragic 73.9% |
| Apache | 0.0 /100 | #334 | Tragic 73.7% |
| Ute | 0.0 /100 | #335 | Tragic 73.7% |
| Crow | 0.0 /100 | #336 | Tragic 73.3% |
| Yup'ik | 0.0 /100 | #337 | Tragic 73.2% |
| Puerto Ricans | 0.0 /100 | #338 | Tragic 73.1% |
Demographics Similar to Welsh by In Labor Force | Age 20-64
In terms of in labor force | age 20-64, the demographic groups most similar to Welsh are Trinidadian and Tobagonian (79.0%, a difference of 0.010%), Immigrants from Jamaica (79.0%, a difference of 0.020%), Samoan (79.0%, a difference of 0.040%), Immigrants from North America (79.0%, a difference of 0.040%), and Jamaican (78.9%, a difference of 0.040%).
| Demographics | Rating | Rank | In Labor Force | Age 20-64 |
| Guamanians/Chamorros | 4.5 /100 | #232 | Tragic 79.1% |
| Japanese | 4.0 /100 | #233 | Tragic 79.1% |
| Immigrants | Canada | 3.2 /100 | #234 | Tragic 79.0% |
| Tlingit-Haida | 3.2 /100 | #235 | Tragic 79.0% |
| Samoans | 2.9 /100 | #236 | Tragic 79.0% |
| Immigrants | North America | 2.9 /100 | #237 | Tragic 79.0% |
| Immigrants | Jamaica | 2.6 /100 | #238 | Tragic 79.0% |
| Welsh | 2.4 /100 | #239 | Tragic 79.0% |
| Trinidadians and Tobagonians | 2.3 /100 | #240 | Tragic 79.0% |
| Jamaicans | 2.0 /100 | #241 | Tragic 78.9% |
| Immigrants | Micronesia | 1.9 /100 | #242 | Tragic 78.9% |
| Immigrants | West Indies | 1.7 /100 | #243 | Tragic 78.9% |
| French | 1.5 /100 | #244 | Tragic 78.9% |
| Scottish | 1.3 /100 | #245 | Tragic 78.9% |
| Immigrants | Trinidad and Tobago | 1.1 /100 | #246 | Tragic 78.8% |