Armenian vs Welsh In Labor Force | Age 20-64
COMPARE
Armenian
Welsh
In Labor Force | Age 20-64
In Labor Force | Age 20-64 Comparison
Armenians
Welsh
79.5%
IN LABOR FORCE | AGE 20-64
41.4/ 100
METRIC RATING
179th/ 347
METRIC RANK
79.0%
IN LABOR FORCE | AGE 20-64
2.4/ 100
METRIC RATING
239th/ 347
METRIC RANK
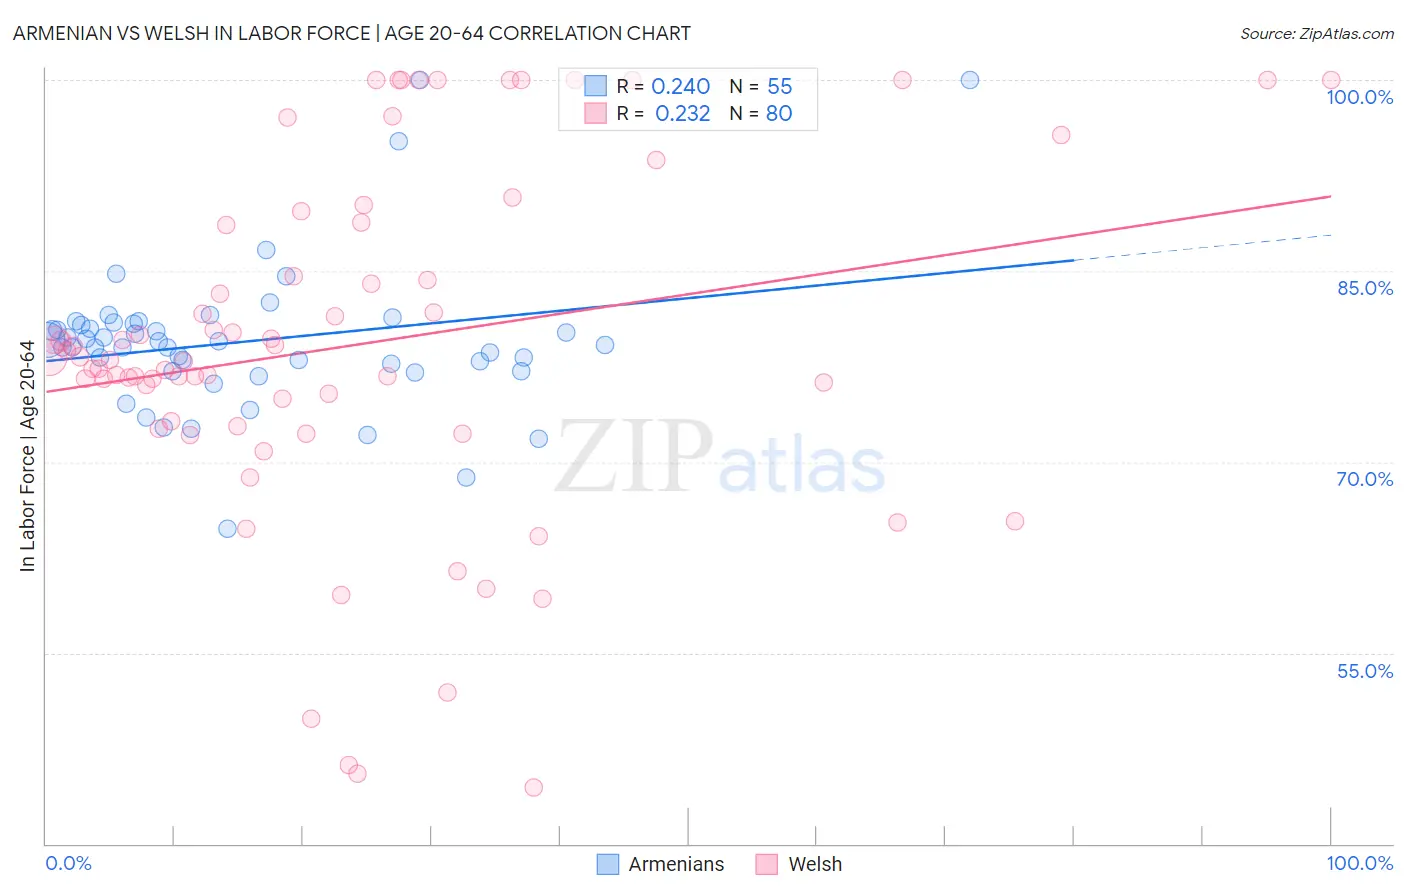
Armenian vs Welsh In Labor Force | Age 20-64 Correlation Chart
The statistical analysis conducted on geographies consisting of 310,959,496 people shows a weak positive correlation between the proportion of Armenians and labor force participation rate among population between the ages 20 and 64 in the United States with a correlation coefficient (R) of 0.240 and weighted average of 79.5%. Similarly, the statistical analysis conducted on geographies consisting of 528,606,062 people shows a weak positive correlation between the proportion of Welsh and labor force participation rate among population between the ages 20 and 64 in the United States with a correlation coefficient (R) of 0.232 and weighted average of 79.0%, a difference of 0.68%.
In Labor Force | Age 20-64 Correlation Summary
| Measurement | Armenian | Welsh |
| Minimum | 64.7% | 44.4% |
| Maximum | 100.0% | 100.0% |
| Range | 35.3% | 55.6% |
| Mean | 79.5% | 79.2% |
| Median | 79.2% | 78.1% |
| Interquartile 25% (IQ1) | 77.1% | 73.0% |
| Interquartile 75% (IQ3) | 80.9% | 88.7% |
| Interquartile Range (IQR) | 3.7% | 15.7% |
| Standard Deviation (Sample) | 5.9% | 13.7% |
| Standard Deviation (Population) | 5.9% | 13.6% |
Similar Demographics by In Labor Force | Age 20-64
Demographics Similar to Armenians by In Labor Force | Age 20-64
In terms of in labor force | age 20-64, the demographic groups most similar to Armenians are Salvadoran (79.5%, a difference of 0.0%), Czechoslovakian (79.5%, a difference of 0.020%), Immigrants from Netherlands (79.5%, a difference of 0.030%), Immigrants from Saudi Arabia (79.5%, a difference of 0.030%), and Cuban (79.5%, a difference of 0.040%).
| Demographics | Rating | Rank | In Labor Force | Age 20-64 |
| Immigrants | Belgium | 53.1 /100 | #172 | Average 79.6% |
| Immigrants | Scotland | 52.4 /100 | #173 | Average 79.6% |
| Syrians | 50.0 /100 | #174 | Average 79.6% |
| Cubans | 46.1 /100 | #175 | Average 79.5% |
| Australians | 46.0 /100 | #176 | Average 79.5% |
| Immigrants | Netherlands | 45.2 /100 | #177 | Average 79.5% |
| Czechoslovakians | 44.3 /100 | #178 | Average 79.5% |
| Armenians | 41.4 /100 | #179 | Average 79.5% |
| Salvadorans | 41.0 /100 | #180 | Average 79.5% |
| Immigrants | Saudi Arabia | 37.7 /100 | #181 | Fair 79.5% |
| Malaysians | 37.1 /100 | #182 | Fair 79.5% |
| Immigrants | Hungary | 36.8 /100 | #183 | Fair 79.5% |
| Finns | 35.9 /100 | #184 | Fair 79.5% |
| Israelis | 34.7 /100 | #185 | Fair 79.5% |
| Northern Europeans | 34.5 /100 | #186 | Fair 79.5% |
Demographics Similar to Welsh by In Labor Force | Age 20-64
In terms of in labor force | age 20-64, the demographic groups most similar to Welsh are Trinidadian and Tobagonian (79.0%, a difference of 0.010%), Immigrants from Jamaica (79.0%, a difference of 0.020%), Samoan (79.0%, a difference of 0.040%), Immigrants from North America (79.0%, a difference of 0.040%), and Jamaican (78.9%, a difference of 0.040%).
| Demographics | Rating | Rank | In Labor Force | Age 20-64 |
| Guamanians/Chamorros | 4.5 /100 | #232 | Tragic 79.1% |
| Japanese | 4.0 /100 | #233 | Tragic 79.1% |
| Immigrants | Canada | 3.2 /100 | #234 | Tragic 79.0% |
| Tlingit-Haida | 3.2 /100 | #235 | Tragic 79.0% |
| Samoans | 2.9 /100 | #236 | Tragic 79.0% |
| Immigrants | North America | 2.9 /100 | #237 | Tragic 79.0% |
| Immigrants | Jamaica | 2.6 /100 | #238 | Tragic 79.0% |
| Welsh | 2.4 /100 | #239 | Tragic 79.0% |
| Trinidadians and Tobagonians | 2.3 /100 | #240 | Tragic 79.0% |
| Jamaicans | 2.0 /100 | #241 | Tragic 78.9% |
| Immigrants | Micronesia | 1.9 /100 | #242 | Tragic 78.9% |
| Immigrants | West Indies | 1.7 /100 | #243 | Tragic 78.9% |
| French | 1.5 /100 | #244 | Tragic 78.9% |
| Scottish | 1.3 /100 | #245 | Tragic 78.9% |
| Immigrants | Trinidad and Tobago | 1.1 /100 | #246 | Tragic 78.8% |