Spanish American Indian vs Austrian In Labor Force | Age 25-29
COMPARE
Spanish American Indian
Austrian
In Labor Force | Age 25-29
In Labor Force | Age 25-29 Comparison
Spanish American Indians
Austrians
82.9%
IN LABOR FORCE | AGE 25-29
0.0/ 100
METRIC RATING
300th/ 347
METRIC RANK
85.1%
IN LABOR FORCE | AGE 25-29
95.3/ 100
METRIC RATING
93rd/ 347
METRIC RANK
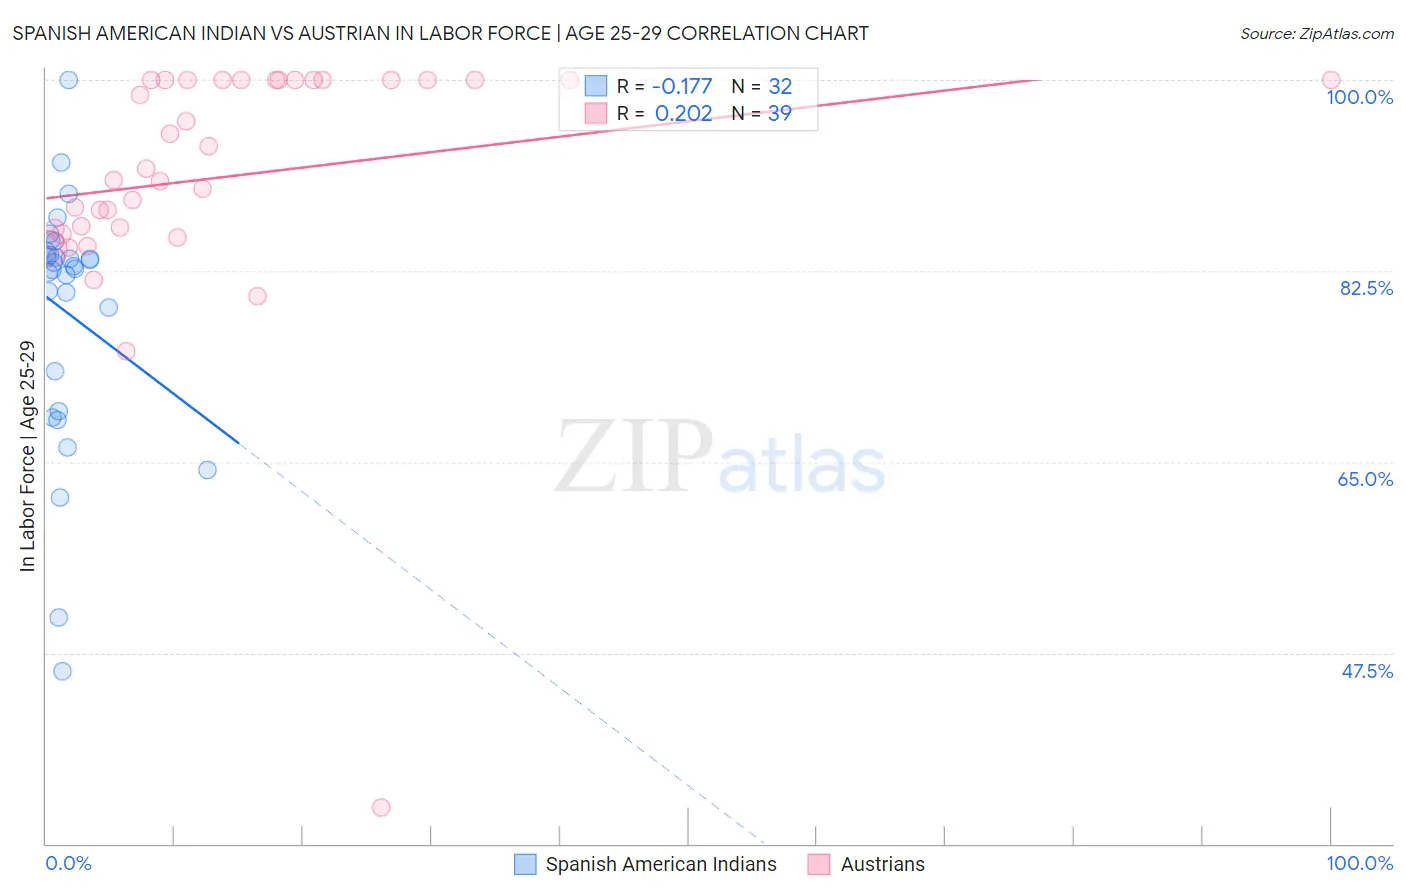
Spanish American Indian vs Austrian In Labor Force | Age 25-29 Correlation Chart
The statistical analysis conducted on geographies consisting of 73,142,306 people shows a poor negative correlation between the proportion of Spanish American Indians and labor force participation rate among population between the ages 25 and 29 in the United States with a correlation coefficient (R) of -0.177 and weighted average of 82.9%. Similarly, the statistical analysis conducted on geographies consisting of 451,766,643 people shows a weak positive correlation between the proportion of Austrians and labor force participation rate among population between the ages 25 and 29 in the United States with a correlation coefficient (R) of 0.202 and weighted average of 85.1%, a difference of 2.7%.
In Labor Force | Age 25-29 Correlation Summary
| Measurement | Spanish American Indian | Austrian |
| Minimum | 45.8% | 33.3% |
| Maximum | 100.0% | 100.0% |
| Range | 54.2% | 66.7% |
| Mean | 78.7% | 91.2% |
| Median | 82.8% | 91.8% |
| Interquartile 25% (IQ1) | 71.5% | 86.4% |
| Interquartile 75% (IQ3) | 84.1% | 100.0% |
| Interquartile Range (IQR) | 12.6% | 13.6% |
| Standard Deviation (Sample) | 11.5% | 11.9% |
| Standard Deviation (Population) | 11.3% | 11.7% |
Similar Demographics by In Labor Force | Age 25-29
Demographics Similar to Spanish American Indians by In Labor Force | Age 25-29
In terms of in labor force | age 25-29, the demographic groups most similar to Spanish American Indians are Fijian (82.9%, a difference of 0.010%), Native Hawaiian (82.9%, a difference of 0.020%), Potawatomi (82.9%, a difference of 0.030%), Immigrants from Latin America (82.9%, a difference of 0.040%), and Nepalese (82.9%, a difference of 0.040%).
| Demographics | Rating | Rank | In Labor Force | Age 25-29 |
| Immigrants | Latin America | 0.0 /100 | #293 | Tragic 82.9% |
| Nepalese | 0.0 /100 | #294 | Tragic 82.9% |
| Chippewa | 0.0 /100 | #295 | Tragic 82.9% |
| Immigrants | Nicaragua | 0.0 /100 | #296 | Tragic 82.9% |
| Potawatomi | 0.0 /100 | #297 | Tragic 82.9% |
| Native Hawaiians | 0.0 /100 | #298 | Tragic 82.9% |
| Fijians | 0.0 /100 | #299 | Tragic 82.9% |
| Spanish American Indians | 0.0 /100 | #300 | Tragic 82.9% |
| Vietnamese | 0.0 /100 | #301 | Tragic 82.8% |
| Immigrants | Belize | 0.0 /100 | #302 | Tragic 82.8% |
| Immigrants | Grenada | 0.0 /100 | #303 | Tragic 82.8% |
| Immigrants | St. Vincent and the Grenadines | 0.0 /100 | #304 | Tragic 82.7% |
| Blacks/African Americans | 0.0 /100 | #305 | Tragic 82.6% |
| Blackfeet | 0.0 /100 | #306 | Tragic 82.6% |
| Cajuns | 0.0 /100 | #307 | Tragic 82.5% |
Demographics Similar to Austrians by In Labor Force | Age 25-29
In terms of in labor force | age 25-29, the demographic groups most similar to Austrians are Immigrants from Costa Rica (85.1%, a difference of 0.010%), Immigrants from Moldova (85.1%, a difference of 0.020%), Immigrants from Korea (85.1%, a difference of 0.020%), Burmese (85.1%, a difference of 0.030%), and Immigrants from Netherlands (85.1%, a difference of 0.030%).
| Demographics | Rating | Rank | In Labor Force | Age 25-29 |
| Ukrainians | 96.7 /100 | #86 | Exceptional 85.2% |
| French Canadians | 96.5 /100 | #87 | Exceptional 85.2% |
| Immigrants | Croatia | 96.4 /100 | #88 | Exceptional 85.2% |
| Immigrants | France | 96.3 /100 | #89 | Exceptional 85.2% |
| Burmese | 95.9 /100 | #90 | Exceptional 85.1% |
| Immigrants | Moldova | 95.8 /100 | #91 | Exceptional 85.1% |
| Immigrants | Costa Rica | 95.5 /100 | #92 | Exceptional 85.1% |
| Austrians | 95.3 /100 | #93 | Exceptional 85.1% |
| Immigrants | Korea | 94.8 /100 | #94 | Exceptional 85.1% |
| Immigrants | Netherlands | 94.6 /100 | #95 | Exceptional 85.1% |
| Immigrants | Romania | 94.6 /100 | #96 | Exceptional 85.1% |
| Immigrants | Sudan | 94.3 /100 | #97 | Exceptional 85.1% |
| Mongolians | 94.1 /100 | #98 | Exceptional 85.1% |
| Bangladeshis | 94.0 /100 | #99 | Exceptional 85.1% |
| Immigrants | Switzerland | 93.9 /100 | #100 | Exceptional 85.1% |