Spanish American Indian vs Immigrants from Micronesia In Labor Force | Age 25-29
COMPARE
Spanish American Indian
Immigrants from Micronesia
In Labor Force | Age 25-29
In Labor Force | Age 25-29 Comparison
Spanish American Indians
Immigrants from Micronesia
82.9%
IN LABOR FORCE | AGE 25-29
0.0/ 100
METRIC RATING
300th/ 347
METRIC RANK
83.0%
IN LABOR FORCE | AGE 25-29
0.0/ 100
METRIC RATING
289th/ 347
METRIC RANK
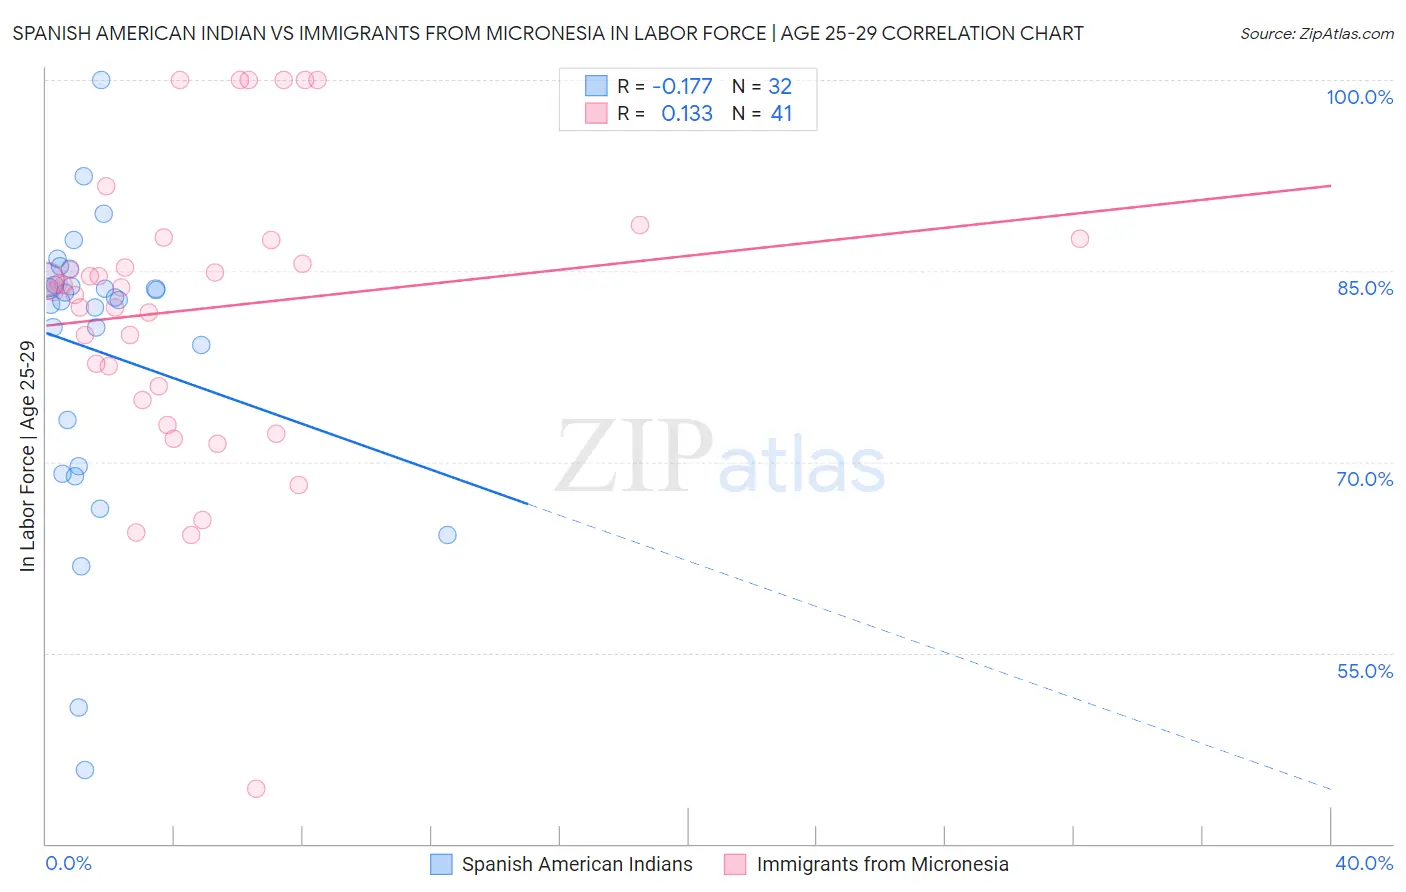
Spanish American Indian vs Immigrants from Micronesia In Labor Force | Age 25-29 Correlation Chart
The statistical analysis conducted on geographies consisting of 73,142,306 people shows a poor negative correlation between the proportion of Spanish American Indians and labor force participation rate among population between the ages 25 and 29 in the United States with a correlation coefficient (R) of -0.177 and weighted average of 82.9%. Similarly, the statistical analysis conducted on geographies consisting of 61,602,386 people shows a poor positive correlation between the proportion of Immigrants from Micronesia and labor force participation rate among population between the ages 25 and 29 in the United States with a correlation coefficient (R) of 0.133 and weighted average of 83.0%, a difference of 0.13%.
In Labor Force | Age 25-29 Correlation Summary
| Measurement | Spanish American Indian | Immigrants from Micronesia |
| Minimum | 45.8% | 44.3% |
| Maximum | 100.0% | 100.0% |
| Range | 54.2% | 55.7% |
| Mean | 78.7% | 82.0% |
| Median | 82.8% | 83.7% |
| Interquartile 25% (IQ1) | 71.5% | 75.4% |
| Interquartile 75% (IQ3) | 84.1% | 87.4% |
| Interquartile Range (IQR) | 12.6% | 12.0% |
| Standard Deviation (Sample) | 11.5% | 11.5% |
| Standard Deviation (Population) | 11.3% | 11.4% |
Demographics Similar to Spanish American Indians and Immigrants from Micronesia by In Labor Force | Age 25-29
In terms of in labor force | age 25-29, the demographic groups most similar to Spanish American Indians are Fijian (82.9%, a difference of 0.010%), Native Hawaiian (82.9%, a difference of 0.020%), Potawatomi (82.9%, a difference of 0.030%), Immigrants from Latin America (82.9%, a difference of 0.040%), and Nepalese (82.9%, a difference of 0.040%). Similarly, the demographic groups most similar to Immigrants from Micronesia are Ottawa (83.0%, a difference of 0.020%), Immigrants from Bangladesh (83.0%, a difference of 0.030%), Hawaiian (83.0%, a difference of 0.030%), Guyanese (83.0%, a difference of 0.050%), and Immigrants from Guyana (83.0%, a difference of 0.050%).
| Demographics | Rating | Rank | In Labor Force | Age 25-29 |
| Nicaraguans | 0.0 /100 | #284 | Tragic 83.1% |
| Belizeans | 0.0 /100 | #285 | Tragic 83.1% |
| Mexican American Indians | 0.0 /100 | #286 | Tragic 83.0% |
| Guyanese | 0.0 /100 | #287 | Tragic 83.0% |
| Ottawa | 0.0 /100 | #288 | Tragic 83.0% |
| Immigrants | Micronesia | 0.0 /100 | #289 | Tragic 83.0% |
| Immigrants | Bangladesh | 0.0 /100 | #290 | Tragic 83.0% |
| Hawaiians | 0.0 /100 | #291 | Tragic 83.0% |
| Immigrants | Guyana | 0.0 /100 | #292 | Tragic 83.0% |
| Immigrants | Latin America | 0.0 /100 | #293 | Tragic 82.9% |
| Nepalese | 0.0 /100 | #294 | Tragic 82.9% |
| Chippewa | 0.0 /100 | #295 | Tragic 82.9% |
| Immigrants | Nicaragua | 0.0 /100 | #296 | Tragic 82.9% |
| Potawatomi | 0.0 /100 | #297 | Tragic 82.9% |
| Native Hawaiians | 0.0 /100 | #298 | Tragic 82.9% |
| Fijians | 0.0 /100 | #299 | Tragic 82.9% |
| Spanish American Indians | 0.0 /100 | #300 | Tragic 82.9% |
| Vietnamese | 0.0 /100 | #301 | Tragic 82.8% |
| Immigrants | Belize | 0.0 /100 | #302 | Tragic 82.8% |
| Immigrants | Grenada | 0.0 /100 | #303 | Tragic 82.8% |
| Immigrants | St. Vincent and the Grenadines | 0.0 /100 | #304 | Tragic 82.7% |