Spanish American Indian vs Marshallese In Labor Force | Age 25-29
COMPARE
Spanish American Indian
Marshallese
In Labor Force | Age 25-29
In Labor Force | Age 25-29 Comparison
Spanish American Indians
Marshallese
82.9%
IN LABOR FORCE | AGE 25-29
0.0/ 100
METRIC RATING
300th/ 347
METRIC RANK
83.3%
IN LABOR FORCE | AGE 25-29
0.0/ 100
METRIC RATING
274th/ 347
METRIC RANK
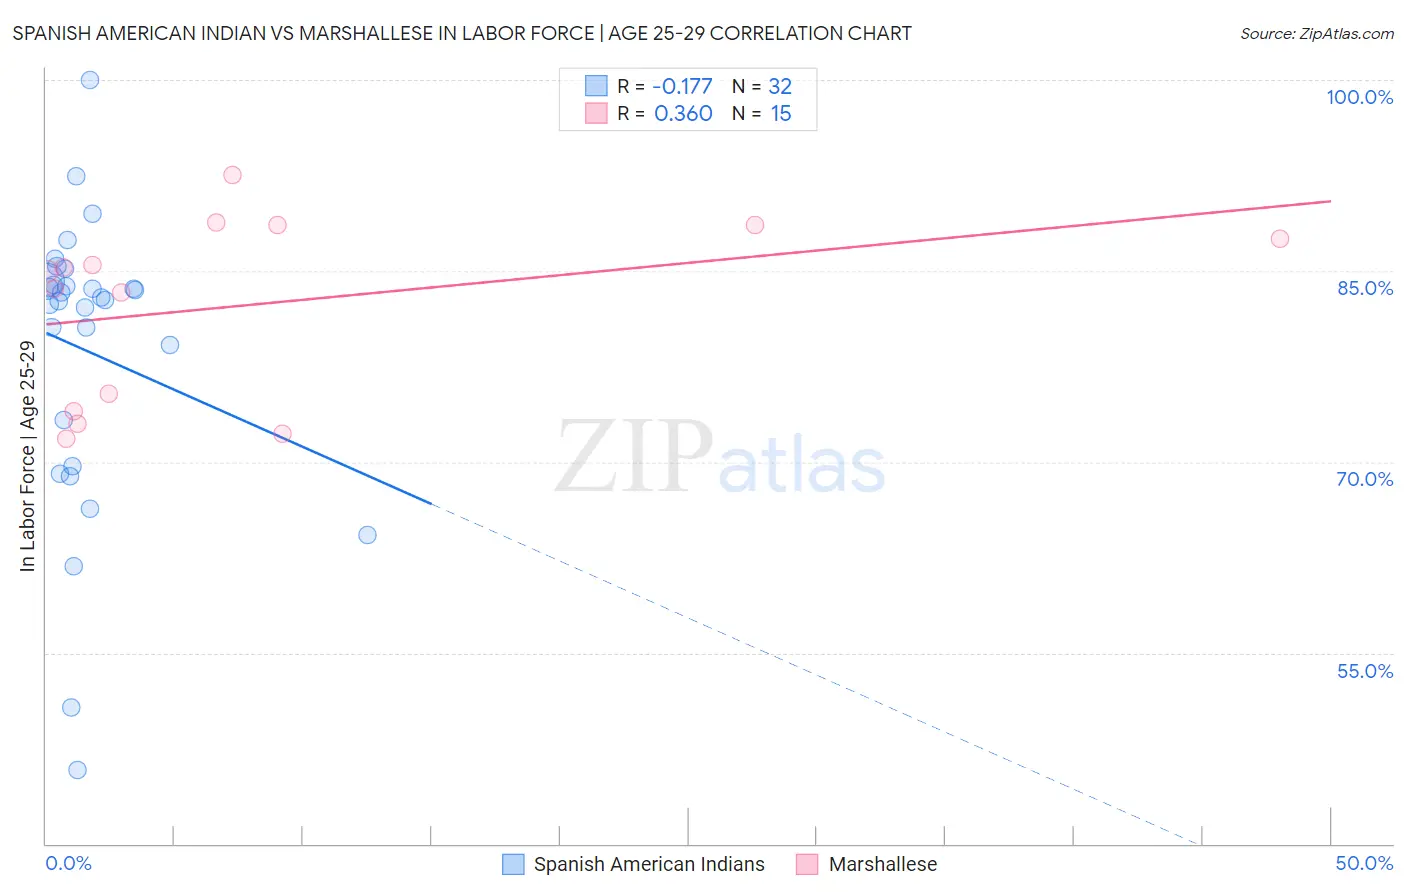
Spanish American Indian vs Marshallese In Labor Force | Age 25-29 Correlation Chart
The statistical analysis conducted on geographies consisting of 73,142,306 people shows a poor negative correlation between the proportion of Spanish American Indians and labor force participation rate among population between the ages 25 and 29 in the United States with a correlation coefficient (R) of -0.177 and weighted average of 82.9%. Similarly, the statistical analysis conducted on geographies consisting of 14,760,991 people shows a mild positive correlation between the proportion of Marshallese and labor force participation rate among population between the ages 25 and 29 in the United States with a correlation coefficient (R) of 0.360 and weighted average of 83.3%, a difference of 0.53%.
In Labor Force | Age 25-29 Correlation Summary
| Measurement | Spanish American Indian | Marshallese |
| Minimum | 45.8% | 71.9% |
| Maximum | 100.0% | 92.5% |
| Range | 54.2% | 20.6% |
| Mean | 78.7% | 82.3% |
| Median | 82.8% | 85.0% |
| Interquartile 25% (IQ1) | 71.5% | 74.0% |
| Interquartile 75% (IQ3) | 84.1% | 88.6% |
| Interquartile Range (IQR) | 12.6% | 14.6% |
| Standard Deviation (Sample) | 11.5% | 7.0% |
| Standard Deviation (Population) | 11.3% | 6.8% |
Similar Demographics by In Labor Force | Age 25-29
Demographics Similar to Spanish American Indians by In Labor Force | Age 25-29
In terms of in labor force | age 25-29, the demographic groups most similar to Spanish American Indians are Fijian (82.9%, a difference of 0.010%), Native Hawaiian (82.9%, a difference of 0.020%), Potawatomi (82.9%, a difference of 0.030%), Immigrants from Latin America (82.9%, a difference of 0.040%), and Nepalese (82.9%, a difference of 0.040%).
| Demographics | Rating | Rank | In Labor Force | Age 25-29 |
| Immigrants | Latin America | 0.0 /100 | #293 | Tragic 82.9% |
| Nepalese | 0.0 /100 | #294 | Tragic 82.9% |
| Chippewa | 0.0 /100 | #295 | Tragic 82.9% |
| Immigrants | Nicaragua | 0.0 /100 | #296 | Tragic 82.9% |
| Potawatomi | 0.0 /100 | #297 | Tragic 82.9% |
| Native Hawaiians | 0.0 /100 | #298 | Tragic 82.9% |
| Fijians | 0.0 /100 | #299 | Tragic 82.9% |
| Spanish American Indians | 0.0 /100 | #300 | Tragic 82.9% |
| Vietnamese | 0.0 /100 | #301 | Tragic 82.8% |
| Immigrants | Belize | 0.0 /100 | #302 | Tragic 82.8% |
| Immigrants | Grenada | 0.0 /100 | #303 | Tragic 82.8% |
| Immigrants | St. Vincent and the Grenadines | 0.0 /100 | #304 | Tragic 82.7% |
| Blacks/African Americans | 0.0 /100 | #305 | Tragic 82.6% |
| Blackfeet | 0.0 /100 | #306 | Tragic 82.6% |
| Cajuns | 0.0 /100 | #307 | Tragic 82.5% |
Demographics Similar to Marshallese by In Labor Force | Age 25-29
In terms of in labor force | age 25-29, the demographic groups most similar to Marshallese are Immigrants from Caribbean (83.4%, a difference of 0.030%), Immigrants from Dominica (83.4%, a difference of 0.030%), Samoan (83.3%, a difference of 0.050%), Immigrants from Honduras (83.3%, a difference of 0.050%), and Honduran (83.4%, a difference of 0.060%).
| Demographics | Rating | Rank | In Labor Force | Age 25-29 |
| Spanish Americans | 0.0 /100 | #267 | Tragic 83.4% |
| Immigrants | Lebanon | 0.0 /100 | #268 | Tragic 83.4% |
| Immigrants | Barbados | 0.0 /100 | #269 | Tragic 83.4% |
| Basques | 0.0 /100 | #270 | Tragic 83.4% |
| Hondurans | 0.0 /100 | #271 | Tragic 83.4% |
| Immigrants | Caribbean | 0.0 /100 | #272 | Tragic 83.4% |
| Immigrants | Dominica | 0.0 /100 | #273 | Tragic 83.4% |
| Marshallese | 0.0 /100 | #274 | Tragic 83.3% |
| Samoans | 0.0 /100 | #275 | Tragic 83.3% |
| Immigrants | Honduras | 0.0 /100 | #276 | Tragic 83.3% |
| Africans | 0.0 /100 | #277 | Tragic 83.2% |
| Immigrants | Cuba | 0.0 /100 | #278 | Tragic 83.2% |
| British West Indians | 0.0 /100 | #279 | Tragic 83.2% |
| Dominicans | 0.0 /100 | #280 | Tragic 83.2% |
| Immigrants | Dominican Republic | 0.0 /100 | #281 | Tragic 83.1% |