Spanish American Indian vs Immigrants from Cambodia In Labor Force | Age 25-29
COMPARE
Spanish American Indian
Immigrants from Cambodia
In Labor Force | Age 25-29
In Labor Force | Age 25-29 Comparison
Spanish American Indians
Immigrants from Cambodia
82.9%
IN LABOR FORCE | AGE 25-29
0.0/ 100
METRIC RATING
300th/ 347
METRIC RANK
84.4%
IN LABOR FORCE | AGE 25-29
14.3/ 100
METRIC RATING
206th/ 347
METRIC RANK
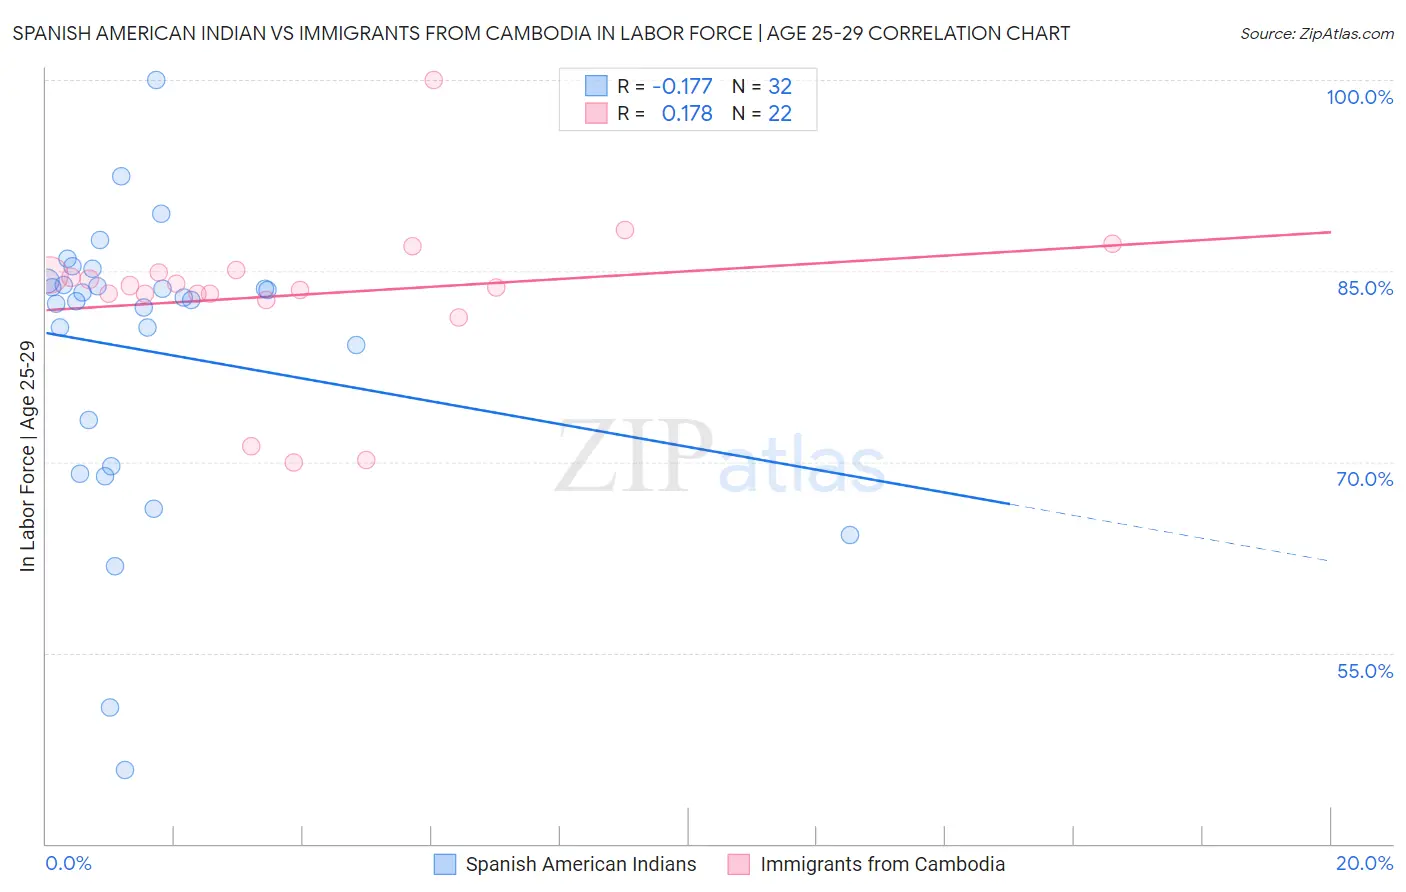
Spanish American Indian vs Immigrants from Cambodia In Labor Force | Age 25-29 Correlation Chart
The statistical analysis conducted on geographies consisting of 73,142,306 people shows a poor negative correlation between the proportion of Spanish American Indians and labor force participation rate among population between the ages 25 and 29 in the United States with a correlation coefficient (R) of -0.177 and weighted average of 82.9%. Similarly, the statistical analysis conducted on geographies consisting of 205,138,607 people shows a poor positive correlation between the proportion of Immigrants from Cambodia and labor force participation rate among population between the ages 25 and 29 in the United States with a correlation coefficient (R) of 0.178 and weighted average of 84.4%, a difference of 1.8%.
In Labor Force | Age 25-29 Correlation Summary
| Measurement | Spanish American Indian | Immigrants from Cambodia |
| Minimum | 45.8% | 69.9% |
| Maximum | 100.0% | 100.0% |
| Range | 54.2% | 30.1% |
| Mean | 78.7% | 83.1% |
| Median | 82.8% | 83.8% |
| Interquartile 25% (IQ1) | 71.5% | 83.2% |
| Interquartile 75% (IQ3) | 84.1% | 84.9% |
| Interquartile Range (IQR) | 12.6% | 1.7% |
| Standard Deviation (Sample) | 11.5% | 6.3% |
| Standard Deviation (Population) | 11.3% | 6.2% |
Similar Demographics by In Labor Force | Age 25-29
Demographics Similar to Spanish American Indians by In Labor Force | Age 25-29
In terms of in labor force | age 25-29, the demographic groups most similar to Spanish American Indians are Fijian (82.9%, a difference of 0.010%), Native Hawaiian (82.9%, a difference of 0.020%), Potawatomi (82.9%, a difference of 0.030%), Immigrants from Latin America (82.9%, a difference of 0.040%), and Nepalese (82.9%, a difference of 0.040%).
| Demographics | Rating | Rank | In Labor Force | Age 25-29 |
| Immigrants | Latin America | 0.0 /100 | #293 | Tragic 82.9% |
| Nepalese | 0.0 /100 | #294 | Tragic 82.9% |
| Chippewa | 0.0 /100 | #295 | Tragic 82.9% |
| Immigrants | Nicaragua | 0.0 /100 | #296 | Tragic 82.9% |
| Potawatomi | 0.0 /100 | #297 | Tragic 82.9% |
| Native Hawaiians | 0.0 /100 | #298 | Tragic 82.9% |
| Fijians | 0.0 /100 | #299 | Tragic 82.9% |
| Spanish American Indians | 0.0 /100 | #300 | Tragic 82.9% |
| Vietnamese | 0.0 /100 | #301 | Tragic 82.8% |
| Immigrants | Belize | 0.0 /100 | #302 | Tragic 82.8% |
| Immigrants | Grenada | 0.0 /100 | #303 | Tragic 82.8% |
| Immigrants | St. Vincent and the Grenadines | 0.0 /100 | #304 | Tragic 82.7% |
| Blacks/African Americans | 0.0 /100 | #305 | Tragic 82.6% |
| Blackfeet | 0.0 /100 | #306 | Tragic 82.6% |
| Cajuns | 0.0 /100 | #307 | Tragic 82.5% |
Demographics Similar to Immigrants from Cambodia by In Labor Force | Age 25-29
In terms of in labor force | age 25-29, the demographic groups most similar to Immigrants from Cambodia are Venezuelan (84.4%, a difference of 0.010%), Ecuadorian (84.4%, a difference of 0.010%), Afghan (84.4%, a difference of 0.020%), Immigrants from Afghanistan (84.4%, a difference of 0.020%), and Immigrants from Armenia (84.4%, a difference of 0.020%).
| Demographics | Rating | Rank | In Labor Force | Age 25-29 |
| Immigrants | Germany | 18.3 /100 | #199 | Poor 84.4% |
| Immigrants | Kazakhstan | 17.5 /100 | #200 | Poor 84.4% |
| Laotians | 16.6 /100 | #201 | Poor 84.4% |
| Afghans | 15.9 /100 | #202 | Poor 84.4% |
| Immigrants | Afghanistan | 15.6 /100 | #203 | Poor 84.4% |
| Venezuelans | 15.1 /100 | #204 | Poor 84.4% |
| Ecuadorians | 14.8 /100 | #205 | Poor 84.4% |
| Immigrants | Cambodia | 14.3 /100 | #206 | Poor 84.4% |
| Immigrants | Armenia | 13.3 /100 | #207 | Poor 84.4% |
| Immigrants | Indonesia | 13.2 /100 | #208 | Poor 84.4% |
| Immigrants | Jordan | 12.8 /100 | #209 | Poor 84.4% |
| Chinese | 12.7 /100 | #210 | Poor 84.3% |
| Immigrants | Venezuela | 12.6 /100 | #211 | Poor 84.3% |
| Sub-Saharan Africans | 11.7 /100 | #212 | Poor 84.3% |
| Japanese | 11.4 /100 | #213 | Poor 84.3% |