Spanish American Indian vs Austrian Unemployment Among Ages 60 to 64 years

COMPARE

Spanish American Indian
Race
Ancestry
AfghanAfricanAlaska NativeAlaskan AthabascanAlbanianAleutAlsatianAmericanApacheArabArapahoArgentineanArmenianAssyrian/Chaldean/SyriacAustralianBahamianBangladeshiBarbadianBasqueBelgianBelizeanBermudanBhutaneseBlackfeetBolivianBrazilianBritishBritish West IndianBulgarianBurmeseCajunCambodianCanadianCape VerdeanCarpatho RusynCelticCentral AmericanCentral American IndianCherokeeCheyenneChickasawChileanChineseChippewaChoctawColombianColvilleComancheCosta RicanCreeCreekCroatianCrowCubanCypriotCzechCzechoslovakianDanishDelawareDominicanDutchDutch West IndianEastern EuropeanEcuadorianEgyptianEnglishEstonianEthiopianEuropeanFijianFilipinoFinnishFrenchFrench American IndianFrench CanadianGermanGerman RussianGhanaianGreekGuamanian/ChamorroGuatemalanGuyaneseHaitianHmongHonduranHopiHoumaHungarianIcelanderIndian (Asian)IndonesianInupiatIranianIraqiIrishIroquoisIsraeliItalianJamaicanJapaneseJordanianKenyanKiowaKoreanLaotianLatvianLebaneseLiberianLithuanianLumbeeLuxembourgerMacedonianMalaysianMalteseMarshalleseMenomineeMexicanMexican American IndianMongolianMoroccanNative HawaiianNavajoNepaleseNew ZealanderNicaraguanNigerianNorthern EuropeanNorwegianOkinawanOsageOttawaPaiutePakistaniPalestinianPanamanianParaguayanPennsylvania GermanPeruvianPimaPolishPortuguesePotawatomiPuebloPuerto RicanPuget Sound SalishRomanianRussianSalvadoranSamoanScandinavianScotch-IrishScottishSeminoleSenegaleseSerbianShoshoneSierra LeoneanSiouxSlavicSlovakSloveneSomaliSouth AfricanSouth AmericanSouth American IndianSoviet UnionSpaniardSpanishSpanish AmericanSpanish American IndianSri LankanSubsaharan AfricanSudaneseSwedishSwissSyrianTaiwaneseThaiTlingit-HaidaTohono O'OdhamTonganTrinidadian and TobagonianTsimshianTurkishU.S. Virgin IslanderUgandanUkrainianUruguayanUteVenezuelanVietnameseWelshWest IndianYakamaYaquiYugoslavianYumanYup'ikZimbabwean
Immigration
NonimmigrantsImmigrantsAfghanistanAfricaAlbaniaArgentinaArmeniaAsiaAustraliaAustriaBahamasBangladeshBarbadosBelarusBelgiumBelizeBoliviaBosnia and HerzegovinaBrazilBulgariaBurma/MyanmarCabo VerdeCambodiaCameroonCanadaCaribbeanCentral AmericaChileChinaColombiaCongoCosta RicaCroatiaCubaCzechoslovakiaDenmarkDominicaDominican RepublicEastern AfricaEastern AsiaEastern EuropeEcuadorEgyptEl SalvadorEnglandEritreaEthiopiaEuropeFijiFranceGermanyGhanaGreeceGrenadaGuatemalaGuyanaHaitiHondurasHong KongHungaryIndiaIndonesiaIranIraqIrelandIsraelItalyJamaicaJapanJordanKazakhstanKenyaKoreaKuwaitLaosLatin AmericaLatviaLebanonLiberiaLithuaniaMalaysiaMexicoMicronesiaMiddle AfricaMoldovaMoroccoNepalNetherlandsNicaraguaNigeriaNorth AmericaNorth MacedoniaNorthern AfricaNorthern EuropeNorwayOceaniaPakistanPanamaPeruPhilippinesPolandPortugalRomaniaRussiaSaudi ArabiaScotlandSenegalSerbiaSierra LeoneSingaporeSomaliaSouth AfricaSouth AmericaSouth Central AsiaSouth Eastern AsiaSouthern EuropeSpainSri LankaSt. Vincent and the GrenadinesSudanSwedenSwitzerlandSyriaTaiwanThailandTrinidad and TobagoTurkeyUgandaUkraineUruguayUzbekistanVenezuelaVietnamWest IndiesWestern AfricaWestern AsiaWestern EuropeYemenZaireZimbabweAzores
Austrian
Race
Ancestry
AfghanAfricanAlaska NativeAlaskan AthabascanAlbanianAleutAlsatianAmericanApacheArabArapahoArgentineanArmenianAssyrian/Chaldean/SyriacAustralianAustrianBahamianBangladeshiBarbadianBasqueBelgianBelizeanBermudanBhutaneseBlackfeetBolivianBrazilianBritishBritish West IndianBulgarianBurmeseCajunCambodianCanadianCape VerdeanCarpatho RusynCelticCentral AmericanCentral American IndianCherokeeCheyenneChickasawChileanChineseChippewaChoctawColombianColvilleComancheCosta RicanCreeCreekCroatianCrowCubanCypriotCzechCzechoslovakianDanishDelawareDominicanDutchDutch West IndianEastern EuropeanEcuadorianEgyptianEnglishEstonianEthiopianEuropeanFijianFilipinoFinnishFrenchFrench American IndianFrench CanadianGermanGerman RussianGhanaianGreekGuamanian/ChamorroGuatemalanGuyaneseHaitianHmongHonduranHopiHoumaHungarianIcelanderIndian (Asian)IndonesianInupiatIranianIraqiIrishIroquoisIsraeliItalianJamaicanJapaneseJordanianKenyanKiowaKoreanLaotianLatvianLebaneseLiberianLithuanianLumbeeLuxembourgerMacedonianMalaysianMalteseMarshalleseMenomineeMexicanMexican American IndianMongolianMoroccanNative HawaiianNavajoNepaleseNew ZealanderNicaraguanNigerianNorthern EuropeanNorwegianOkinawanOsageOttawaPaiutePakistaniPalestinianPanamanianParaguayanPennsylvania GermanPeruvianPimaPolishPortuguesePotawatomiPuebloPuerto RicanPuget Sound SalishRomanianRussianSalvadoranSamoanScandinavianScotch-IrishScottishSeminoleSenegaleseSerbianShoshoneSierra LeoneanSiouxSlavicSlovakSloveneSomaliSouth AfricanSouth AmericanSouth American IndianSoviet UnionSpaniardSpanishSpanish AmericanSri LankanSubsaharan AfricanSudaneseSwedishSwissSyrianTaiwaneseThaiTlingit-HaidaTohono O'OdhamTonganTrinidadian and TobagonianTsimshianTurkishU.S. Virgin IslanderUgandanUkrainianUruguayanUteVenezuelanVietnameseWelshWest IndianYakamaYaquiYugoslavianYumanYup'ikZimbabwean
Immigration
NonimmigrantsImmigrantsAfghanistanAfricaAlbaniaArgentinaArmeniaAsiaAustraliaAustriaBahamasBangladeshBarbadosBelarusBelgiumBelizeBoliviaBosnia and HerzegovinaBrazilBulgariaBurma/MyanmarCabo VerdeCambodiaCameroonCanadaCaribbeanCentral AmericaChileChinaColombiaCongoCosta RicaCroatiaCubaCzechoslovakiaDenmarkDominicaDominican RepublicEastern AfricaEastern AsiaEastern EuropeEcuadorEgyptEl SalvadorEnglandEritreaEthiopiaEuropeFijiFranceGermanyGhanaGreeceGrenadaGuatemalaGuyanaHaitiHondurasHong KongHungaryIndiaIndonesiaIranIraqIrelandIsraelItalyJamaicaJapanJordanKazakhstanKenyaKoreaKuwaitLaosLatin AmericaLatviaLebanonLiberiaLithuaniaMalaysiaMexicoMicronesiaMiddle AfricaMoldovaMoroccoNepalNetherlandsNicaraguaNigeriaNorth AmericaNorth MacedoniaNorthern AfricaNorthern EuropeNorwayOceaniaPakistanPanamaPeruPhilippinesPolandPortugalRomaniaRussiaSaudi ArabiaScotlandSenegalSerbiaSierra LeoneSingaporeSomaliaSouth AfricaSouth AmericaSouth Central AsiaSouth Eastern AsiaSouthern EuropeSpainSri LankaSt. Vincent and the GrenadinesSudanSwedenSwitzerlandSyriaTaiwanThailandTrinidad and TobagoTurkeyUgandaUkraineUruguayUzbekistanVenezuelaVietnamWest IndiesWestern AfricaWestern AsiaWestern EuropeYemenZaireZimbabweAzores
Unemployment Among Ages 60 to 64 years
Income
Poverty
Unemployment
Labor Participation
Family Structure
Vehicle Availability
Education Level
Disability

Unemployment Among Ages 60 to 64 years Comparison

Spanish American Indians

Austrians

Tragic
Exceptional
5.4%
UNEMPLOYMENT AMONG AGES 60 TO 64 YEARS
0.0/ 100
METRIC RATING
308th/ 347
METRIC RANK
4.8%
UNEMPLOYMENT AMONG AGES 60 TO 64 YEARS
91.9/ 100
METRIC RATING
127th/ 347
METRIC RANK

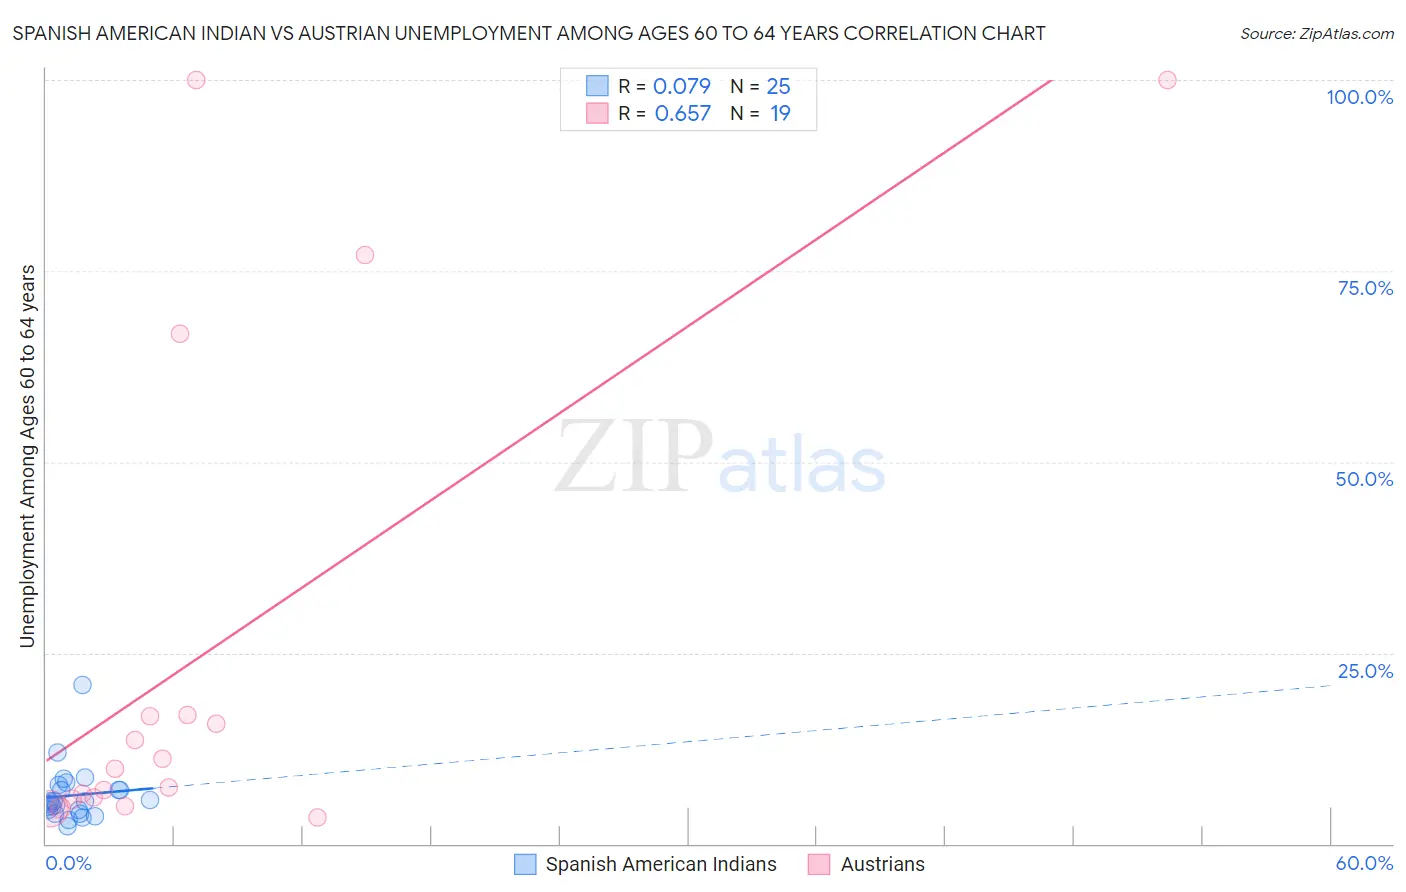
Spanish American Indian vs Austrian Unemployment Among Ages 60 to 64 years Correlation Chart

The statistical analysis conducted on geographies consisting of 71,908,857 people shows a slight positive correlation between the proportion of Spanish American Indians and unemployment rate among population between the ages 60 and 64 in the United States with a correlation coefficient (R) of 0.079 and weighted average of 5.4%. Similarly, the statistical analysis conducted on geographies consisting of 397,069,556 people shows a significant positive correlation between the proportion of Austrians and unemployment rate among population between the ages 60 and 64 in the United States with a correlation coefficient (R) of 0.657 and weighted average of 4.8%, a difference of 13.8%.
Spanish American Indian vs Austrian Unemployment Among Ages 60 to 64 years

Unemployment Among Ages 60 to 64 years Correlation Summary

MeasurementSpanish American IndianAustrian
Minimum2.3%3.5%
Maximum20.8%100.0%
Range18.5%96.5%
Mean6.3%25.2%
Median5.5%9.9%
Interquartile 25% (IQ1)4.2%5.8%
Interquartile 75% (IQ3)7.4%16.8%
Interquartile Range (IQR)3.2%11.0%
Standard Deviation (Sample)3.7%33.2%
Standard Deviation (Population)3.6%32.3%

Similar Demographics by Unemployment Among Ages 60 to 64 years

Demographics Similar to Spanish American Indians by Unemployment Among Ages 60 to 64 years

In terms of unemployment among ages 60 to 64 years, the demographic groups most similar to Spanish American Indians are Soviet Union (5.4%, a difference of 0.010%), Immigrants from Guyana (5.4%, a difference of 0.020%), Immigrants from Dominica (5.4%, a difference of 0.18%), Cypriot (5.4%, a difference of 0.25%), and Immigrants from Mexico (5.4%, a difference of 0.27%).
DemographicsRating | RankUnemployment Among Ages 60 to 64 years
Immigrants | Jamaica
0.0
/100
|
#301
Tragic
5.4%
Barbadians
0.0
/100
|
#302
Tragic
5.4%
Bahamians
0.0
/100
|
#303
Tragic
5.4%
Immigrants | Mexico
0.0
/100
|
#304
Tragic
5.4%
Cypriots
0.0
/100
|
#305
Tragic
5.4%
Immigrants | Dominica
0.0
/100
|
#306
Tragic
5.4%
Immigrants | Guyana
0.0
/100
|
#307
Tragic
5.4%
Spanish American Indians
0.0
/100
|
#308
Tragic
5.4%
Soviet Union
0.0
/100
|
#309
Tragic
5.4%
British West Indians
0.0
/100
|
#310
Tragic
5.5%
U.S. Virgin Islanders
0.0
/100
|
#311
Tragic
5.5%
Immigrants | West Indies
0.0
/100
|
#312
Tragic
5.5%
Belizeans
0.0
/100
|
#313
Tragic
5.5%
Guyanese
0.0
/100
|
#314
Tragic
5.5%
Cree
0.0
/100
|
#315
Tragic
5.6%

Demographics Similar to Austrians by Unemployment Among Ages 60 to 64 years

In terms of unemployment among ages 60 to 64 years, the demographic groups most similar to Austrians are Immigrants from South Central Asia (4.7%, a difference of 0.14%), Choctaw (4.8%, a difference of 0.18%), Immigrants from Serbia (4.8%, a difference of 0.18%), Immigrants from Syria (4.8%, a difference of 0.19%), and Immigrants from Thailand (4.7%, a difference of 0.24%).
DemographicsRating | RankUnemployment Among Ages 60 to 64 years
Macedonians
95.7
/100
|
#120
Exceptional
4.7%
Albanians
95.3
/100
|
#121
Exceptional
4.7%
Immigrants | Kazakhstan
95.1
/100
|
#122
Exceptional
4.7%
Finns
94.7
/100
|
#123
Exceptional
4.7%
Immigrants | Senegal
94.5
/100
|
#124
Exceptional
4.7%
Immigrants | Thailand
93.7
/100
|
#125
Exceptional
4.7%
Immigrants | South Central Asia
93.0
/100
|
#126
Exceptional
4.7%
Austrians
91.9
/100
|
#127
Exceptional
4.8%
Choctaw
90.3
/100
|
#128
Exceptional
4.8%
Immigrants | Serbia
90.2
/100
|
#129
Exceptional
4.8%
Immigrants | Syria
90.1
/100
|
#130
Exceptional
4.8%
Immigrants | Lebanon
89.6
/100
|
#131
Excellent
4.8%
Lithuanians
89.6
/100
|
#132
Excellent
4.8%
Yaqui
89.5
/100
|
#133
Excellent
4.8%
Basques
88.8
/100
|
#134
Excellent
4.8%