Immigrants from Germany vs Austrian In Labor Force | Age 25-29
COMPARE
Immigrants from Germany
Austrian
In Labor Force | Age 25-29
In Labor Force | Age 25-29 Comparison
Immigrants from Germany
Austrians
84.4%
IN LABOR FORCE | AGE 25-29
18.3/ 100
METRIC RATING
199th/ 347
METRIC RANK
85.1%
IN LABOR FORCE | AGE 25-29
95.3/ 100
METRIC RATING
93rd/ 347
METRIC RANK
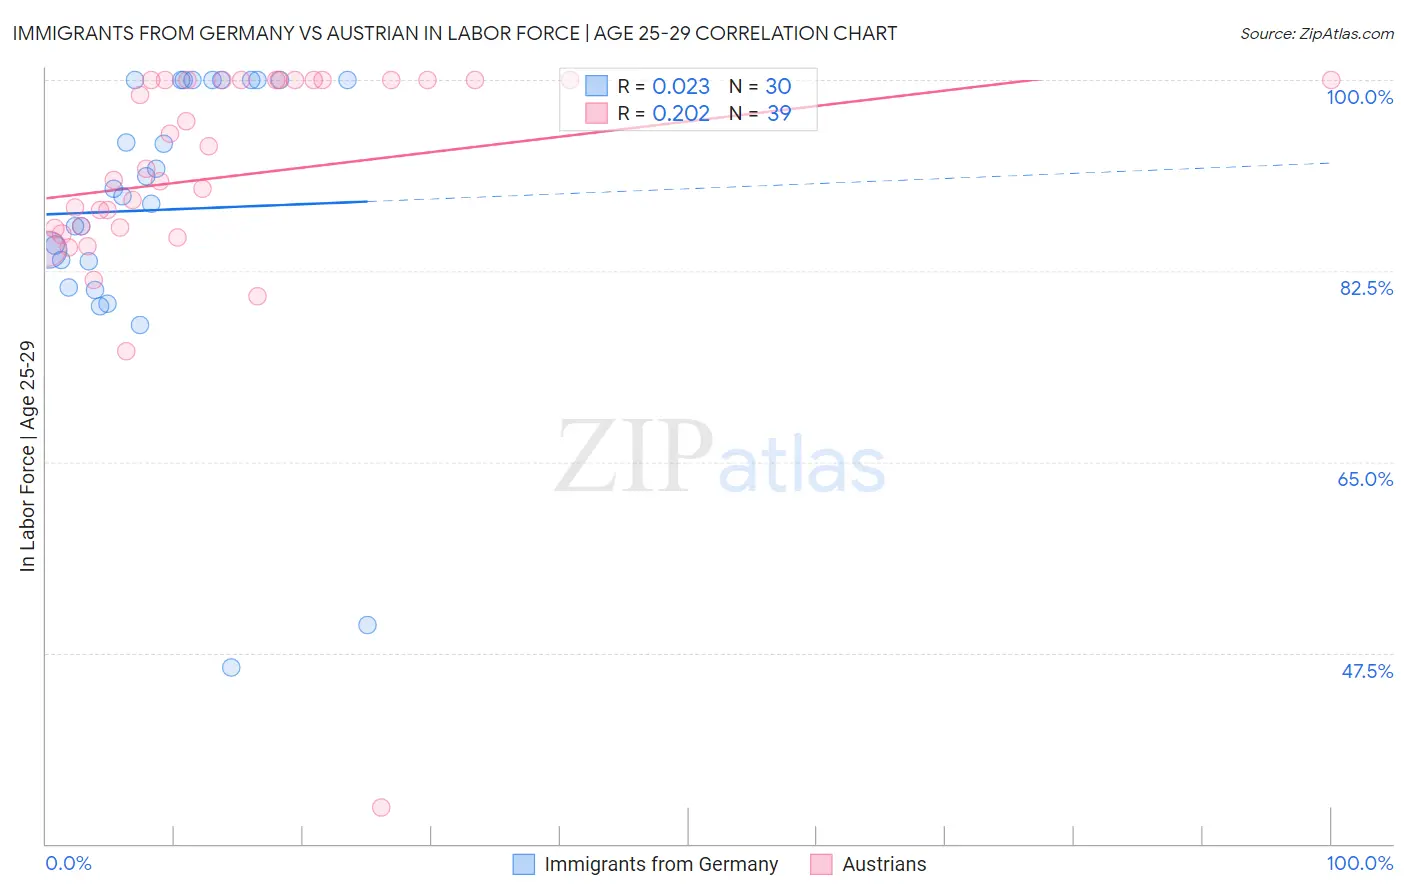
Immigrants from Germany vs Austrian In Labor Force | Age 25-29 Correlation Chart
The statistical analysis conducted on geographies consisting of 463,583,295 people shows no correlation between the proportion of Immigrants from Germany and labor force participation rate among population between the ages 25 and 29 in the United States with a correlation coefficient (R) of 0.023 and weighted average of 84.4%. Similarly, the statistical analysis conducted on geographies consisting of 451,766,643 people shows a weak positive correlation between the proportion of Austrians and labor force participation rate among population between the ages 25 and 29 in the United States with a correlation coefficient (R) of 0.202 and weighted average of 85.1%, a difference of 0.83%.
In Labor Force | Age 25-29 Correlation Summary
| Measurement | Immigrants from Germany | Austrian |
| Minimum | 46.2% | 33.3% |
| Maximum | 100.0% | 100.0% |
| Range | 53.8% | 66.7% |
| Mean | 88.1% | 91.2% |
| Median | 89.7% | 91.8% |
| Interquartile 25% (IQ1) | 83.3% | 86.4% |
| Interquartile 75% (IQ3) | 100.0% | 100.0% |
| Interquartile Range (IQR) | 16.7% | 13.6% |
| Standard Deviation (Sample) | 13.4% | 11.9% |
| Standard Deviation (Population) | 13.1% | 11.7% |
Similar Demographics by In Labor Force | Age 25-29
Demographics Similar to Immigrants from Germany by In Labor Force | Age 25-29
In terms of in labor force | age 25-29, the demographic groups most similar to Immigrants from Germany are Immigrants from South Eastern Asia (84.4%, a difference of 0.010%), Tlingit-Haida (84.4%, a difference of 0.010%), Immigrants from Iraq (84.4%, a difference of 0.010%), Immigrants from Kazakhstan (84.4%, a difference of 0.010%), and Laotian (84.4%, a difference of 0.020%).
| Demographics | Rating | Rank | In Labor Force | Age 25-29 |
| English | 25.8 /100 | #192 | Fair 84.5% |
| South American Indians | 25.0 /100 | #193 | Fair 84.5% |
| Portuguese | 21.2 /100 | #194 | Fair 84.4% |
| Immigrants | Israel | 20.8 /100 | #195 | Fair 84.4% |
| Immigrants | South Eastern Asia | 19.5 /100 | #196 | Poor 84.4% |
| Tlingit-Haida | 19.3 /100 | #197 | Poor 84.4% |
| Immigrants | Iraq | 19.0 /100 | #198 | Poor 84.4% |
| Immigrants | Germany | 18.3 /100 | #199 | Poor 84.4% |
| Immigrants | Kazakhstan | 17.5 /100 | #200 | Poor 84.4% |
| Laotians | 16.6 /100 | #201 | Poor 84.4% |
| Afghans | 15.9 /100 | #202 | Poor 84.4% |
| Immigrants | Afghanistan | 15.6 /100 | #203 | Poor 84.4% |
| Venezuelans | 15.1 /100 | #204 | Poor 84.4% |
| Ecuadorians | 14.8 /100 | #205 | Poor 84.4% |
| Immigrants | Cambodia | 14.3 /100 | #206 | Poor 84.4% |
Demographics Similar to Austrians by In Labor Force | Age 25-29
In terms of in labor force | age 25-29, the demographic groups most similar to Austrians are Immigrants from Costa Rica (85.1%, a difference of 0.010%), Immigrants from Moldova (85.1%, a difference of 0.020%), Immigrants from Korea (85.1%, a difference of 0.020%), Burmese (85.1%, a difference of 0.030%), and Immigrants from Netherlands (85.1%, a difference of 0.030%).
| Demographics | Rating | Rank | In Labor Force | Age 25-29 |
| Ukrainians | 96.7 /100 | #86 | Exceptional 85.2% |
| French Canadians | 96.5 /100 | #87 | Exceptional 85.2% |
| Immigrants | Croatia | 96.4 /100 | #88 | Exceptional 85.2% |
| Immigrants | France | 96.3 /100 | #89 | Exceptional 85.2% |
| Burmese | 95.9 /100 | #90 | Exceptional 85.1% |
| Immigrants | Moldova | 95.8 /100 | #91 | Exceptional 85.1% |
| Immigrants | Costa Rica | 95.5 /100 | #92 | Exceptional 85.1% |
| Austrians | 95.3 /100 | #93 | Exceptional 85.1% |
| Immigrants | Korea | 94.8 /100 | #94 | Exceptional 85.1% |
| Immigrants | Netherlands | 94.6 /100 | #95 | Exceptional 85.1% |
| Immigrants | Romania | 94.6 /100 | #96 | Exceptional 85.1% |
| Immigrants | Sudan | 94.3 /100 | #97 | Exceptional 85.1% |
| Mongolians | 94.1 /100 | #98 | Exceptional 85.1% |
| Bangladeshis | 94.0 /100 | #99 | Exceptional 85.1% |
| Immigrants | Switzerland | 93.9 /100 | #100 | Exceptional 85.1% |