Spanish American Indian vs Austrian Doctorate Degree
COMPARE
Spanish American Indian
Austrian
Doctorate Degree
Doctorate Degree Comparison
Spanish American Indians
Austrians
1.1%
DOCTORATE DEGREE
0.0/ 100
METRIC RATING
346th/ 347
METRIC RANK
2.1%
DOCTORATE DEGREE
98.0/ 100
METRIC RATING
104th/ 347
METRIC RANK
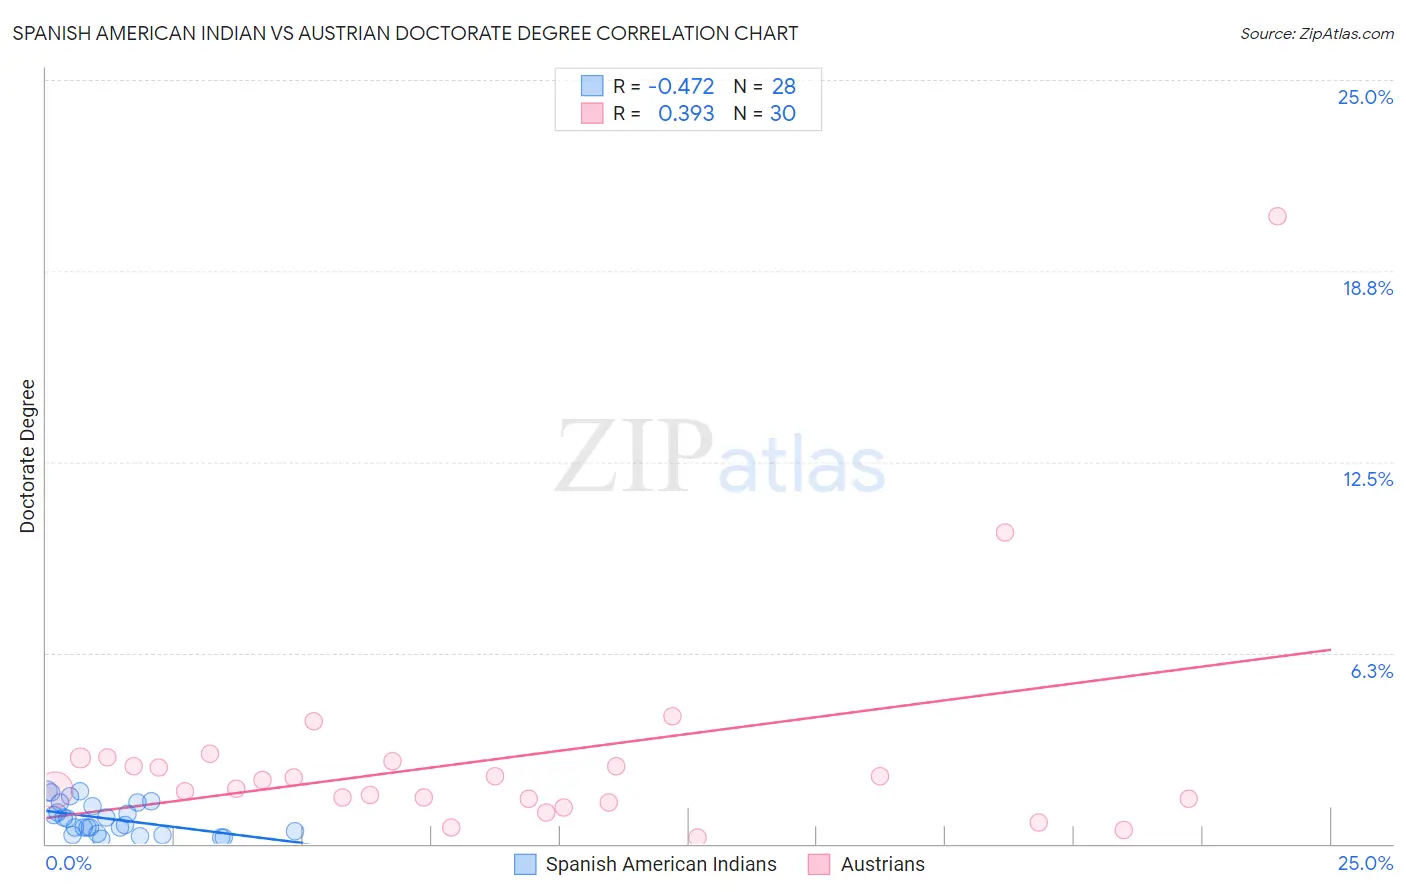
Spanish American Indian vs Austrian Doctorate Degree Correlation Chart
The statistical analysis conducted on geographies consisting of 72,925,634 people shows a moderate negative correlation between the proportion of Spanish American Indians and percentage of population with at least doctorate degree education in the United States with a correlation coefficient (R) of -0.472 and weighted average of 1.1%. Similarly, the statistical analysis conducted on geographies consisting of 445,801,331 people shows a mild positive correlation between the proportion of Austrians and percentage of population with at least doctorate degree education in the United States with a correlation coefficient (R) of 0.393 and weighted average of 2.1%, a difference of 98.4%.
Doctorate Degree Correlation Summary
| Measurement | Spanish American Indian | Austrian |
| Minimum | 0.18% | 0.20% |
| Maximum | 1.7% | 20.5% |
| Range | 1.6% | 20.3% |
| Mean | 0.82% | 2.8% |
| Median | 0.73% | 1.9% |
| Interquartile 25% (IQ1) | 0.36% | 1.5% |
| Interquartile 75% (IQ3) | 1.3% | 2.7% |
| Interquartile Range (IQR) | 0.93% | 1.2% |
| Standard Deviation (Sample) | 0.51% | 3.8% |
| Standard Deviation (Population) | 0.50% | 3.7% |
Similar Demographics by Doctorate Degree
Demographics Similar to Spanish American Indians by Doctorate Degree
In terms of doctorate degree, the demographic groups most similar to Spanish American Indians are Lumbee (1.1%, a difference of 2.8%), Immigrants from Mexico (1.1%, a difference of 4.4%), Fijian (1.1%, a difference of 6.5%), Arapaho (1.2%, a difference of 10.2%), and Houma (0.96%, a difference of 10.5%).
| Demographics | Rating | Rank | Doctorate Degree |
| Immigrants | Caribbean | 0.0 /100 | #333 | Tragic 1.3% |
| Immigrants | Dominican Republic | 0.0 /100 | #334 | Tragic 1.3% |
| Immigrants | Haiti | 0.0 /100 | #335 | Tragic 1.3% |
| Nepalese | 0.0 /100 | #336 | Tragic 1.3% |
| Bangladeshis | 0.0 /100 | #337 | Tragic 1.2% |
| Puget Sound Salish | 0.0 /100 | #338 | Tragic 1.2% |
| Immigrants | Central America | 0.0 /100 | #339 | Tragic 1.2% |
| Immigrants | Cuba | 0.0 /100 | #340 | Tragic 1.2% |
| Mexicans | 0.0 /100 | #341 | Tragic 1.2% |
| Arapaho | 0.0 /100 | #342 | Tragic 1.2% |
| Fijians | 0.0 /100 | #343 | Tragic 1.1% |
| Immigrants | Mexico | 0.0 /100 | #344 | Tragic 1.1% |
| Lumbee | 0.0 /100 | #345 | Tragic 1.1% |
| Spanish American Indians | 0.0 /100 | #346 | Tragic 1.1% |
| Houma | 0.0 /100 | #347 | Tragic 0.96% |
Demographics Similar to Austrians by Doctorate Degree
In terms of doctorate degree, the demographic groups most similar to Austrians are Romanian (2.1%, a difference of 0.12%), Immigrants from Chile (2.1%, a difference of 0.13%), Immigrants from Eastern Africa (2.1%, a difference of 0.35%), Arab (2.1%, a difference of 0.35%), and Immigrants from Egypt (2.1%, a difference of 0.38%).
| Demographics | Rating | Rank | Doctorate Degree |
| Immigrants | Eritrea | 98.4 /100 | #97 | Exceptional 2.1% |
| Armenians | 98.3 /100 | #98 | Exceptional 2.1% |
| Immigrants | Egypt | 98.2 /100 | #99 | Exceptional 2.1% |
| Immigrants | Eastern Europe | 98.2 /100 | #100 | Exceptional 2.1% |
| Immigrants | Eastern Africa | 98.2 /100 | #101 | Exceptional 2.1% |
| Immigrants | Chile | 98.1 /100 | #102 | Exceptional 2.1% |
| Romanians | 98.1 /100 | #103 | Exceptional 2.1% |
| Austrians | 98.0 /100 | #104 | Exceptional 2.1% |
| Arabs | 97.8 /100 | #105 | Exceptional 2.1% |
| Sudanese | 97.7 /100 | #106 | Exceptional 2.1% |
| Europeans | 97.5 /100 | #107 | Exceptional 2.1% |
| Immigrants | Germany | 97.3 /100 | #108 | Exceptional 2.1% |
| Ukrainians | 97.2 /100 | #109 | Exceptional 2.1% |
| Brazilians | 97.2 /100 | #110 | Exceptional 2.1% |
| Immigrants | Pakistan | 97.1 /100 | #111 | Exceptional 2.1% |