Immigrants from South America vs Austrian In Labor Force | Age 25-29
COMPARE
Immigrants from South America
Austrian
In Labor Force | Age 25-29
In Labor Force | Age 25-29 Comparison
Immigrants from South America
Austrians
84.6%
IN LABOR FORCE | AGE 25-29
42.9/ 100
METRIC RATING
180th/ 347
METRIC RANK
85.1%
IN LABOR FORCE | AGE 25-29
95.3/ 100
METRIC RATING
93rd/ 347
METRIC RANK
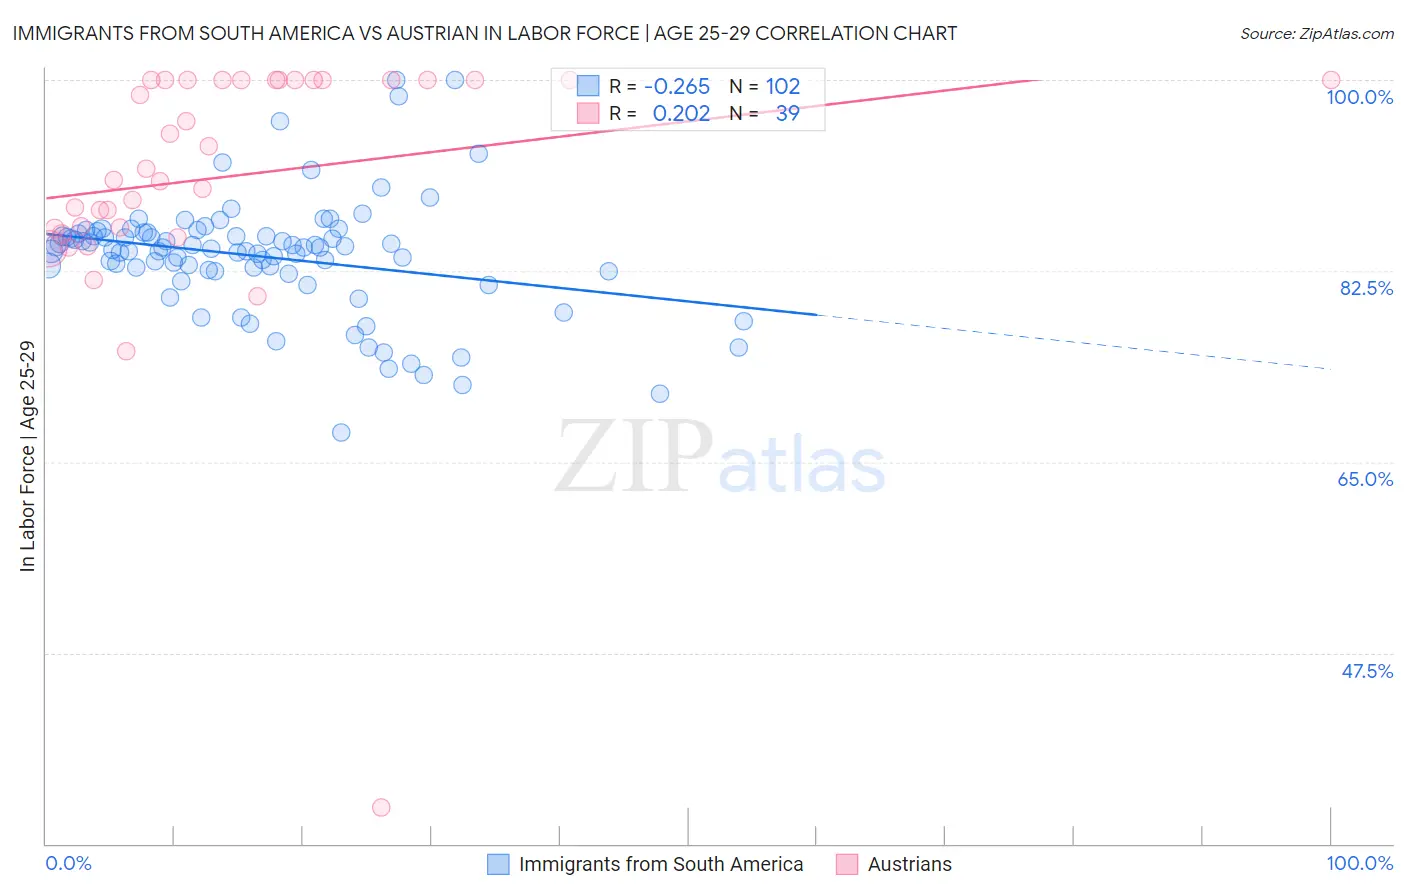
Immigrants from South America vs Austrian In Labor Force | Age 25-29 Correlation Chart
The statistical analysis conducted on geographies consisting of 486,086,715 people shows a weak negative correlation between the proportion of Immigrants from South America and labor force participation rate among population between the ages 25 and 29 in the United States with a correlation coefficient (R) of -0.265 and weighted average of 84.6%. Similarly, the statistical analysis conducted on geographies consisting of 451,766,643 people shows a weak positive correlation between the proportion of Austrians and labor force participation rate among population between the ages 25 and 29 in the United States with a correlation coefficient (R) of 0.202 and weighted average of 85.1%, a difference of 0.61%.
In Labor Force | Age 25-29 Correlation Summary
| Measurement | Immigrants from South America | Austrian |
| Minimum | 67.7% | 33.3% |
| Maximum | 100.0% | 100.0% |
| Range | 32.3% | 66.7% |
| Mean | 83.8% | 91.2% |
| Median | 84.6% | 91.8% |
| Interquartile 25% (IQ1) | 82.5% | 86.4% |
| Interquartile 75% (IQ3) | 85.9% | 100.0% |
| Interquartile Range (IQR) | 3.4% | 13.6% |
| Standard Deviation (Sample) | 5.4% | 11.9% |
| Standard Deviation (Population) | 5.4% | 11.7% |
Similar Demographics by In Labor Force | Age 25-29
Demographics Similar to Immigrants from South America by In Labor Force | Age 25-29
In terms of in labor force | age 25-29, the demographic groups most similar to Immigrants from South America are Immigrants from Argentina (84.6%, a difference of 0.010%), Immigrants from Norway (84.6%, a difference of 0.010%), Immigrants from China (84.6%, a difference of 0.020%), Immigrants from Thailand (84.6%, a difference of 0.020%), and European (84.6%, a difference of 0.020%).
| Demographics | Rating | Rank | In Labor Force | Age 25-29 |
| Assyrians/Chaldeans/Syriacs | 50.2 /100 | #173 | Average 84.7% |
| Palestinians | 50.0 /100 | #174 | Average 84.7% |
| Hungarians | 47.8 /100 | #175 | Average 84.6% |
| Malaysians | 46.8 /100 | #176 | Average 84.6% |
| Immigrants | China | 45.7 /100 | #177 | Average 84.6% |
| Immigrants | Thailand | 45.2 /100 | #178 | Average 84.6% |
| Immigrants | Argentina | 44.0 /100 | #179 | Average 84.6% |
| Immigrants | South America | 42.9 /100 | #180 | Average 84.6% |
| Immigrants | Norway | 41.9 /100 | #181 | Average 84.6% |
| Europeans | 40.3 /100 | #182 | Average 84.6% |
| Scottish | 40.1 /100 | #183 | Average 84.6% |
| Immigrants | Kuwait | 38.2 /100 | #184 | Fair 84.6% |
| Immigrants | Denmark | 37.0 /100 | #185 | Fair 84.6% |
| Immigrants | Belgium | 35.0 /100 | #186 | Fair 84.6% |
| Immigrants | Portugal | 34.7 /100 | #187 | Fair 84.6% |
Demographics Similar to Austrians by In Labor Force | Age 25-29
In terms of in labor force | age 25-29, the demographic groups most similar to Austrians are Immigrants from Costa Rica (85.1%, a difference of 0.010%), Immigrants from Moldova (85.1%, a difference of 0.020%), Immigrants from Korea (85.1%, a difference of 0.020%), Burmese (85.1%, a difference of 0.030%), and Immigrants from Netherlands (85.1%, a difference of 0.030%).
| Demographics | Rating | Rank | In Labor Force | Age 25-29 |
| Ukrainians | 96.7 /100 | #86 | Exceptional 85.2% |
| French Canadians | 96.5 /100 | #87 | Exceptional 85.2% |
| Immigrants | Croatia | 96.4 /100 | #88 | Exceptional 85.2% |
| Immigrants | France | 96.3 /100 | #89 | Exceptional 85.2% |
| Burmese | 95.9 /100 | #90 | Exceptional 85.1% |
| Immigrants | Moldova | 95.8 /100 | #91 | Exceptional 85.1% |
| Immigrants | Costa Rica | 95.5 /100 | #92 | Exceptional 85.1% |
| Austrians | 95.3 /100 | #93 | Exceptional 85.1% |
| Immigrants | Korea | 94.8 /100 | #94 | Exceptional 85.1% |
| Immigrants | Netherlands | 94.6 /100 | #95 | Exceptional 85.1% |
| Immigrants | Romania | 94.6 /100 | #96 | Exceptional 85.1% |
| Immigrants | Sudan | 94.3 /100 | #97 | Exceptional 85.1% |
| Mongolians | 94.1 /100 | #98 | Exceptional 85.1% |
| Bangladeshis | 94.0 /100 | #99 | Exceptional 85.1% |
| Immigrants | Switzerland | 93.9 /100 | #100 | Exceptional 85.1% |