Immigrants from Greece vs Austrian In Labor Force | Age 25-29
COMPARE
Immigrants from Greece
Austrian
In Labor Force | Age 25-29
In Labor Force | Age 25-29 Comparison
Immigrants from Greece
Austrians
85.7%
IN LABOR FORCE | AGE 25-29
99.9/ 100
METRIC RATING
41st/ 347
METRIC RANK
85.1%
IN LABOR FORCE | AGE 25-29
95.3/ 100
METRIC RATING
93rd/ 347
METRIC RANK
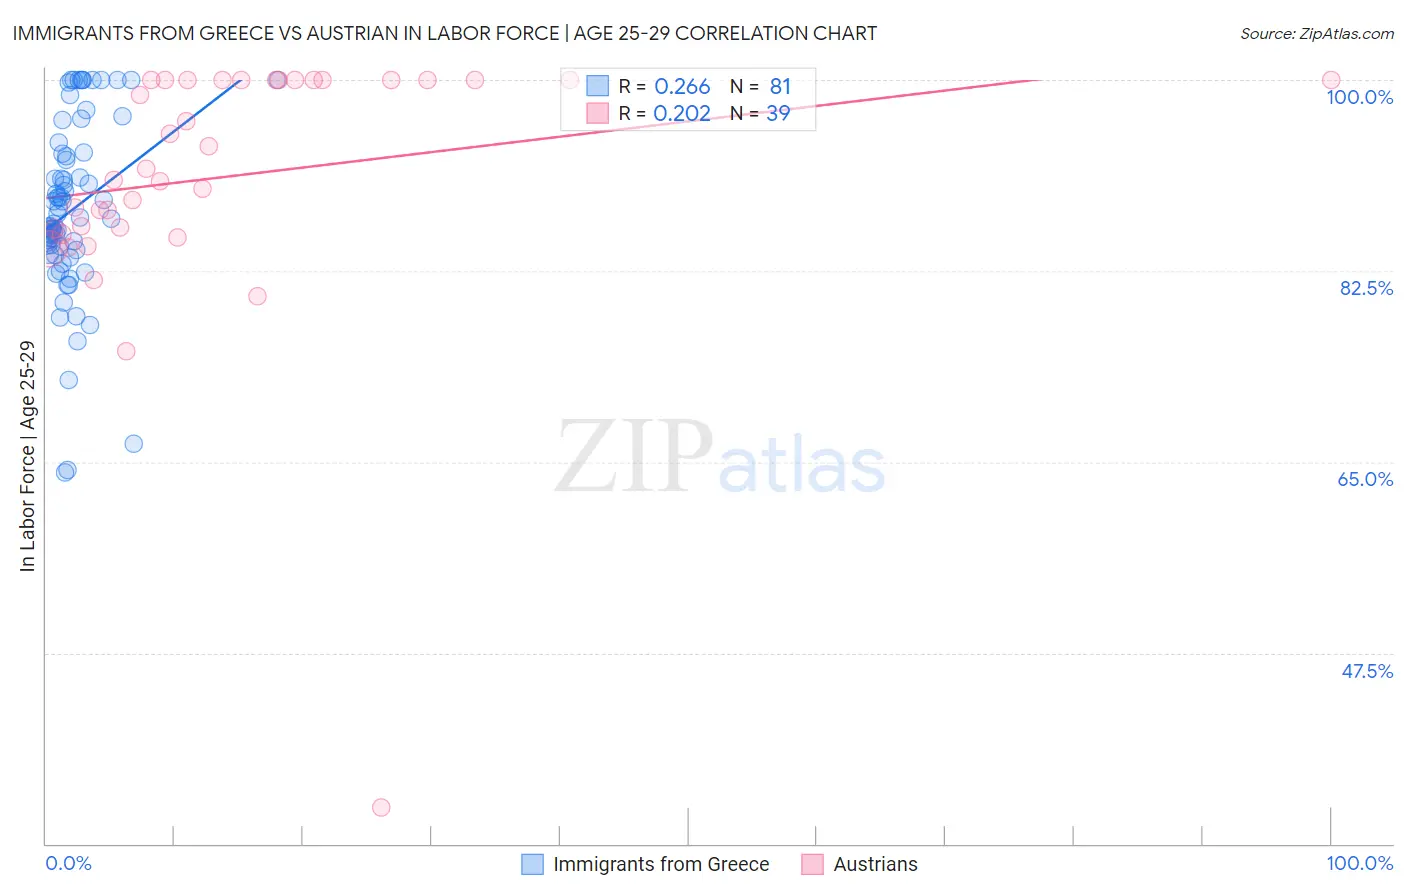
Immigrants from Greece vs Austrian In Labor Force | Age 25-29 Correlation Chart
The statistical analysis conducted on geographies consisting of 216,855,125 people shows a weak positive correlation between the proportion of Immigrants from Greece and labor force participation rate among population between the ages 25 and 29 in the United States with a correlation coefficient (R) of 0.266 and weighted average of 85.7%. Similarly, the statistical analysis conducted on geographies consisting of 451,766,643 people shows a weak positive correlation between the proportion of Austrians and labor force participation rate among population between the ages 25 and 29 in the United States with a correlation coefficient (R) of 0.202 and weighted average of 85.1%, a difference of 0.72%.
In Labor Force | Age 25-29 Correlation Summary
| Measurement | Immigrants from Greece | Austrian |
| Minimum | 64.0% | 33.3% |
| Maximum | 100.0% | 100.0% |
| Range | 36.0% | 66.7% |
| Mean | 88.0% | 91.2% |
| Median | 86.8% | 91.8% |
| Interquartile 25% (IQ1) | 84.6% | 86.4% |
| Interquartile 75% (IQ3) | 93.1% | 100.0% |
| Interquartile Range (IQR) | 8.5% | 13.6% |
| Standard Deviation (Sample) | 8.0% | 11.9% |
| Standard Deviation (Population) | 7.9% | 11.7% |
Similar Demographics by In Labor Force | Age 25-29
Demographics Similar to Immigrants from Greece by In Labor Force | Age 25-29
In terms of in labor force | age 25-29, the demographic groups most similar to Immigrants from Greece are Immigrants from Albania (85.7%, a difference of 0.010%), Sierra Leonean (85.8%, a difference of 0.030%), Croatian (85.8%, a difference of 0.030%), Immigrants from Eritrea (85.7%, a difference of 0.040%), and Polish (85.8%, a difference of 0.050%).
| Demographics | Rating | Rank | In Labor Force | Age 25-29 |
| Lithuanians | 99.9 /100 | #34 | Exceptional 85.8% |
| Cypriots | 99.9 /100 | #35 | Exceptional 85.8% |
| Immigrants | Nepal | 99.9 /100 | #36 | Exceptional 85.8% |
| Poles | 99.9 /100 | #37 | Exceptional 85.8% |
| Sierra Leoneans | 99.9 /100 | #38 | Exceptional 85.8% |
| Croatians | 99.9 /100 | #39 | Exceptional 85.8% |
| Immigrants | Albania | 99.9 /100 | #40 | Exceptional 85.7% |
| Immigrants | Greece | 99.9 /100 | #41 | Exceptional 85.7% |
| Immigrants | Eritrea | 99.9 /100 | #42 | Exceptional 85.7% |
| Immigrants | India | 99.9 /100 | #43 | Exceptional 85.7% |
| Macedonians | 99.9 /100 | #44 | Exceptional 85.7% |
| Immigrants | Sierra Leone | 99.9 /100 | #45 | Exceptional 85.7% |
| Czechs | 99.8 /100 | #46 | Exceptional 85.6% |
| Turks | 99.8 /100 | #47 | Exceptional 85.6% |
| Italians | 99.8 /100 | #48 | Exceptional 85.6% |
Demographics Similar to Austrians by In Labor Force | Age 25-29
In terms of in labor force | age 25-29, the demographic groups most similar to Austrians are Immigrants from Costa Rica (85.1%, a difference of 0.010%), Immigrants from Moldova (85.1%, a difference of 0.020%), Immigrants from Korea (85.1%, a difference of 0.020%), Burmese (85.1%, a difference of 0.030%), and Immigrants from Netherlands (85.1%, a difference of 0.030%).
| Demographics | Rating | Rank | In Labor Force | Age 25-29 |
| Ukrainians | 96.7 /100 | #86 | Exceptional 85.2% |
| French Canadians | 96.5 /100 | #87 | Exceptional 85.2% |
| Immigrants | Croatia | 96.4 /100 | #88 | Exceptional 85.2% |
| Immigrants | France | 96.3 /100 | #89 | Exceptional 85.2% |
| Burmese | 95.9 /100 | #90 | Exceptional 85.1% |
| Immigrants | Moldova | 95.8 /100 | #91 | Exceptional 85.1% |
| Immigrants | Costa Rica | 95.5 /100 | #92 | Exceptional 85.1% |
| Austrians | 95.3 /100 | #93 | Exceptional 85.1% |
| Immigrants | Korea | 94.8 /100 | #94 | Exceptional 85.1% |
| Immigrants | Netherlands | 94.6 /100 | #95 | Exceptional 85.1% |
| Immigrants | Romania | 94.6 /100 | #96 | Exceptional 85.1% |
| Immigrants | Sudan | 94.3 /100 | #97 | Exceptional 85.1% |
| Mongolians | 94.1 /100 | #98 | Exceptional 85.1% |
| Bangladeshis | 94.0 /100 | #99 | Exceptional 85.1% |
| Immigrants | Switzerland | 93.9 /100 | #100 | Exceptional 85.1% |