Sioux vs Malaysian In Labor Force | Age 16-19
COMPARE
Sioux
Malaysian
In Labor Force | Age 16-19
In Labor Force | Age 16-19 Comparison
Sioux
Malaysians
41.5%
IN LABOR FORCE | AGE 16-19
100.0/ 100
METRIC RATING
38th/ 347
METRIC RANK
39.7%
IN LABOR FORCE | AGE 16-19
99.9/ 100
METRIC RATING
76th/ 347
METRIC RANK
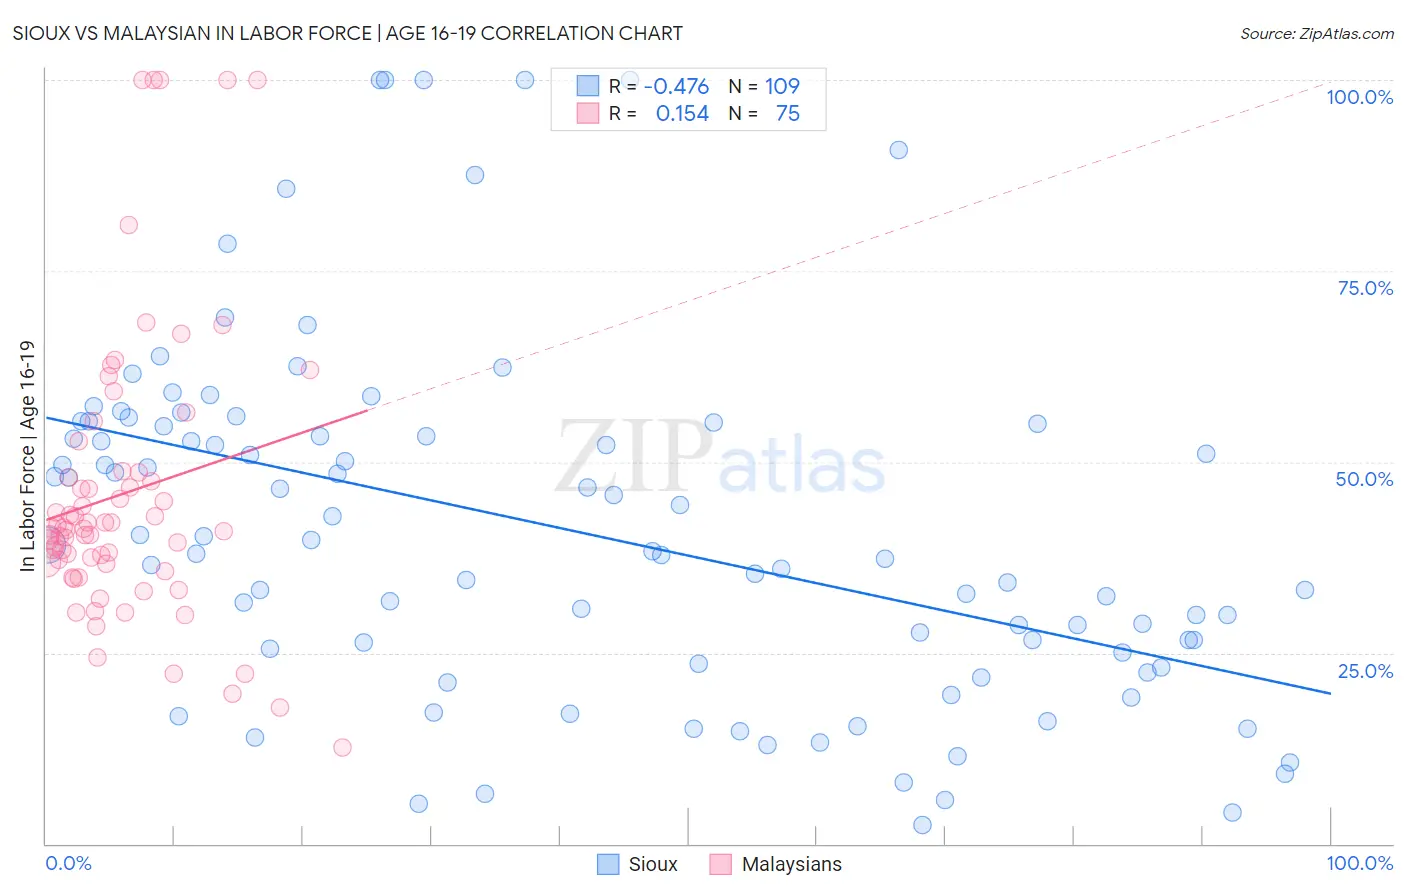
Sioux vs Malaysian In Labor Force | Age 16-19 Correlation Chart
The statistical analysis conducted on geographies consisting of 233,888,038 people shows a moderate negative correlation between the proportion of Sioux and labor force participation rate among population between the ages 16 and 19 in the United States with a correlation coefficient (R) of -0.476 and weighted average of 41.5%. Similarly, the statistical analysis conducted on geographies consisting of 225,967,692 people shows a poor positive correlation between the proportion of Malaysians and labor force participation rate among population between the ages 16 and 19 in the United States with a correlation coefficient (R) of 0.154 and weighted average of 39.7%, a difference of 4.6%.
In Labor Force | Age 16-19 Correlation Summary
| Measurement | Sioux | Malaysian |
| Minimum | 2.4% | 12.6% |
| Maximum | 100.0% | 100.0% |
| Range | 97.6% | 87.4% |
| Mean | 41.1% | 45.8% |
| Median | 38.3% | 41.3% |
| Interquartile 25% (IQ1) | 24.2% | 36.7% |
| Interquartile 75% (IQ3) | 54.9% | 48.6% |
| Interquartile Range (IQR) | 30.6% | 11.9% |
| Standard Deviation (Sample) | 23.0% | 18.9% |
| Standard Deviation (Population) | 22.9% | 18.8% |
Similar Demographics by In Labor Force | Age 16-19
Demographics Similar to Sioux by In Labor Force | Age 16-19
In terms of in labor force | age 16-19, the demographic groups most similar to Sioux are Scotch-Irish (41.5%, a difference of 0.14%), Immigrants from Liberia (41.5%, a difference of 0.23%), Immigrants from Congo (41.7%, a difference of 0.35%), Immigrants from the Azores (41.7%, a difference of 0.42%), and Yugoslavian (41.8%, a difference of 0.57%).
| Demographics | Rating | Rank | In Labor Force | Age 16-19 |
| Irish | 100.0 /100 | #31 | Exceptional 42.0% |
| Czechoslovakians | 100.0 /100 | #32 | Exceptional 41.9% |
| Liberians | 100.0 /100 | #33 | Exceptional 41.8% |
| Immigrants | Bosnia and Herzegovina | 100.0 /100 | #34 | Exceptional 41.8% |
| Yugoslavians | 100.0 /100 | #35 | Exceptional 41.8% |
| Immigrants | Azores | 100.0 /100 | #36 | Exceptional 41.7% |
| Immigrants | Congo | 100.0 /100 | #37 | Exceptional 41.7% |
| Sioux | 100.0 /100 | #38 | Exceptional 41.5% |
| Scotch-Irish | 100.0 /100 | #39 | Exceptional 41.5% |
| Immigrants | Liberia | 100.0 /100 | #40 | Exceptional 41.5% |
| Celtics | 100.0 /100 | #41 | Exceptional 41.3% |
| Whites/Caucasians | 100.0 /100 | #42 | Exceptional 41.3% |
| Tongans | 100.0 /100 | #43 | Exceptional 41.2% |
| Europeans | 100.0 /100 | #44 | Exceptional 41.1% |
| Croatians | 100.0 /100 | #45 | Exceptional 41.1% |
Demographics Similar to Malaysians by In Labor Force | Age 16-19
In terms of in labor force | age 16-19, the demographic groups most similar to Malaysians are Immigrants from Portugal (39.7%, a difference of 0.13%), French American Indian (39.8%, a difference of 0.27%), Hungarian (39.8%, a difference of 0.29%), Immigrants from Middle Africa (39.9%, a difference of 0.52%), and Austrian (39.5%, a difference of 0.52%).
| Demographics | Rating | Rank | In Labor Force | Age 16-19 |
| Potawatomi | 99.9 /100 | #69 | Exceptional 40.0% |
| Portuguese | 99.9 /100 | #70 | Exceptional 40.0% |
| Serbians | 99.9 /100 | #71 | Exceptional 39.9% |
| Iroquois | 99.9 /100 | #72 | Exceptional 39.9% |
| Immigrants | Middle Africa | 99.9 /100 | #73 | Exceptional 39.9% |
| Hungarians | 99.9 /100 | #74 | Exceptional 39.8% |
| French American Indians | 99.9 /100 | #75 | Exceptional 39.8% |
| Malaysians | 99.9 /100 | #76 | Exceptional 39.7% |
| Immigrants | Portugal | 99.9 /100 | #77 | Exceptional 39.7% |
| Austrians | 99.8 /100 | #78 | Exceptional 39.5% |
| Marshallese | 99.8 /100 | #79 | Exceptional 39.5% |
| Immigrants | Iraq | 99.8 /100 | #80 | Exceptional 39.4% |
| Shoshone | 99.7 /100 | #81 | Exceptional 39.3% |
| Basques | 99.7 /100 | #82 | Exceptional 39.3% |
| Spanish | 99.7 /100 | #83 | Exceptional 39.3% |