European vs Chilean In Labor Force | Age 30-34
COMPARE
European
Chilean
In Labor Force | Age 30-34
In Labor Force | Age 30-34 Comparison
Europeans
Chileans
84.3%
IN LABOR FORCE | AGE 30-34
7.2/ 100
METRIC RATING
215th/ 347
METRIC RANK
84.9%
IN LABOR FORCE | AGE 30-34
85.3/ 100
METRIC RATING
141st/ 347
METRIC RANK
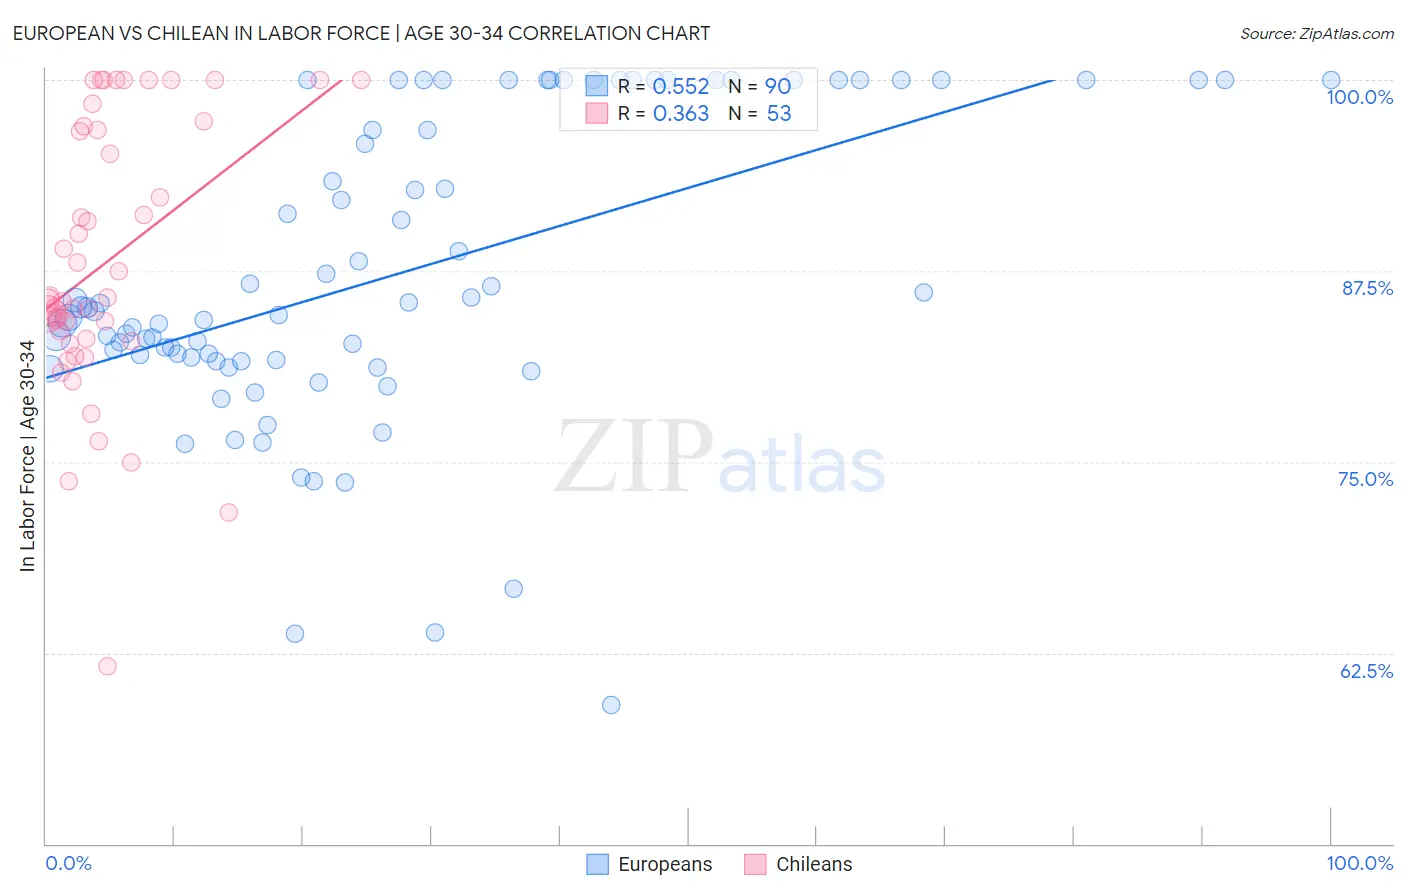
European vs Chilean In Labor Force | Age 30-34 Correlation Chart
The statistical analysis conducted on geographies consisting of 560,760,193 people shows a substantial positive correlation between the proportion of Europeans and labor force participation rate among population between the ages 30 and 34 in the United States with a correlation coefficient (R) of 0.552 and weighted average of 84.3%. Similarly, the statistical analysis conducted on geographies consisting of 256,589,082 people shows a mild positive correlation between the proportion of Chileans and labor force participation rate among population between the ages 30 and 34 in the United States with a correlation coefficient (R) of 0.363 and weighted average of 84.9%, a difference of 0.76%.
In Labor Force | Age 30-34 Correlation Summary
| Measurement | European | Chilean |
| Minimum | 59.1% | 61.6% |
| Maximum | 100.0% | 100.0% |
| Range | 40.9% | 38.4% |
| Mean | 87.3% | 88.0% |
| Median | 85.0% | 85.6% |
| Interquartile 25% (IQ1) | 81.7% | 83.0% |
| Interquartile 75% (IQ3) | 100.0% | 96.8% |
| Interquartile Range (IQR) | 18.3% | 13.8% |
| Standard Deviation (Sample) | 9.8% | 8.8% |
| Standard Deviation (Population) | 9.8% | 8.7% |
Similar Demographics by In Labor Force | Age 30-34
Demographics Similar to Europeans by In Labor Force | Age 30-34
In terms of in labor force | age 30-34, the demographic groups most similar to Europeans are Immigrants from Germany (84.3%, a difference of 0.0%), Immigrants from Ecuador (84.3%, a difference of 0.0%), Immigrants from Trinidad and Tobago (84.3%, a difference of 0.010%), Immigrants from Western Asia (84.3%, a difference of 0.020%), and Immigrants from Jamaica (84.3%, a difference of 0.020%).
| Demographics | Rating | Rank | In Labor Force | Age 30-34 |
| Arabs | 8.9 /100 | #208 | Tragic 84.3% |
| Jamaicans | 8.8 /100 | #209 | Tragic 84.3% |
| Indonesians | 8.8 /100 | #210 | Tragic 84.3% |
| Japanese | 8.8 /100 | #211 | Tragic 84.3% |
| Immigrants | Western Asia | 8.2 /100 | #212 | Tragic 84.3% |
| Immigrants | Jamaica | 7.9 /100 | #213 | Tragic 84.3% |
| Immigrants | Germany | 7.2 /100 | #214 | Tragic 84.3% |
| Europeans | 7.2 /100 | #215 | Tragic 84.3% |
| Immigrants | Ecuador | 7.1 /100 | #216 | Tragic 84.3% |
| Immigrants | Trinidad and Tobago | 7.0 /100 | #217 | Tragic 84.3% |
| Immigrants | Panama | 6.3 /100 | #218 | Tragic 84.3% |
| Swiss | 5.8 /100 | #219 | Tragic 84.3% |
| Danes | 5.3 /100 | #220 | Tragic 84.3% |
| Salvadorans | 3.8 /100 | #221 | Tragic 84.2% |
| Panamanians | 3.8 /100 | #222 | Tragic 84.2% |
Demographics Similar to Chileans by In Labor Force | Age 30-34
In terms of in labor force | age 30-34, the demographic groups most similar to Chileans are Immigrants from Indonesia (84.9%, a difference of 0.010%), Immigrants from Vietnam (85.0%, a difference of 0.020%), Bhutanese (85.0%, a difference of 0.030%), South African (85.0%, a difference of 0.040%), and Sri Lankan (85.0%, a difference of 0.040%).
| Demographics | Rating | Rank | In Labor Force | Age 30-34 |
| Immigrants | Chile | 89.2 /100 | #134 | Excellent 85.0% |
| Immigrants | Asia | 88.9 /100 | #135 | Excellent 85.0% |
| Jordanians | 88.6 /100 | #136 | Excellent 85.0% |
| South Africans | 88.0 /100 | #137 | Excellent 85.0% |
| Sri Lankans | 87.8 /100 | #138 | Excellent 85.0% |
| Bhutanese | 87.5 /100 | #139 | Excellent 85.0% |
| Immigrants | Vietnam | 86.5 /100 | #140 | Excellent 85.0% |
| Chileans | 85.3 /100 | #141 | Excellent 84.9% |
| Immigrants | Indonesia | 84.3 /100 | #142 | Excellent 84.9% |
| Colombians | 82.2 /100 | #143 | Excellent 84.9% |
| Uruguayans | 78.5 /100 | #144 | Good 84.9% |
| Palestinians | 77.7 /100 | #145 | Good 84.9% |
| Immigrants | Saudi Arabia | 76.6 /100 | #146 | Good 84.9% |
| Immigrants | Colombia | 76.3 /100 | #147 | Good 84.9% |
| Immigrants | Pakistan | 76.2 /100 | #148 | Good 84.9% |