Immigrants from Belize vs Chilean In Labor Force | Age 30-34
COMPARE
Immigrants from Belize
Chilean
In Labor Force | Age 30-34
In Labor Force | Age 30-34 Comparison
Immigrants from Belize
Chileans
83.2%
IN LABOR FORCE | AGE 30-34
0.0/ 100
METRIC RATING
284th/ 347
METRIC RANK
84.9%
IN LABOR FORCE | AGE 30-34
85.3/ 100
METRIC RATING
141st/ 347
METRIC RANK
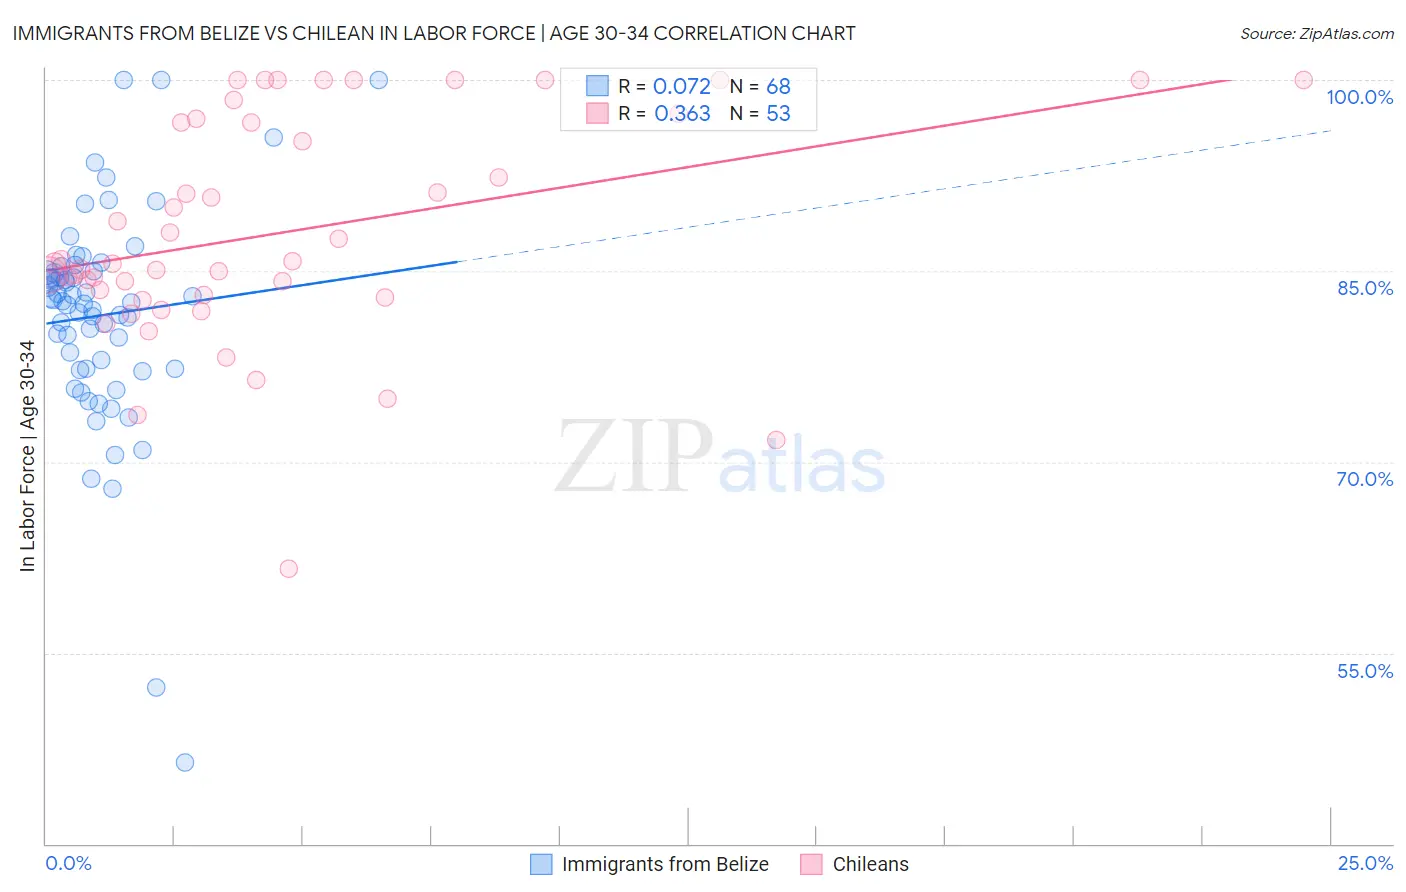
Immigrants from Belize vs Chilean In Labor Force | Age 30-34 Correlation Chart
The statistical analysis conducted on geographies consisting of 130,310,300 people shows a slight positive correlation between the proportion of Immigrants from Belize and labor force participation rate among population between the ages 30 and 34 in the United States with a correlation coefficient (R) of 0.072 and weighted average of 83.2%. Similarly, the statistical analysis conducted on geographies consisting of 256,589,082 people shows a mild positive correlation between the proportion of Chileans and labor force participation rate among population between the ages 30 and 34 in the United States with a correlation coefficient (R) of 0.363 and weighted average of 84.9%, a difference of 2.1%.
In Labor Force | Age 30-34 Correlation Summary
| Measurement | Immigrants from Belize | Chilean |
| Minimum | 46.4% | 61.6% |
| Maximum | 100.0% | 100.0% |
| Range | 53.6% | 38.4% |
| Mean | 81.5% | 88.0% |
| Median | 82.6% | 85.6% |
| Interquartile 25% (IQ1) | 77.3% | 83.0% |
| Interquartile 75% (IQ3) | 84.9% | 96.8% |
| Interquartile Range (IQR) | 7.6% | 13.8% |
| Standard Deviation (Sample) | 8.8% | 8.8% |
| Standard Deviation (Population) | 8.7% | 8.7% |
Similar Demographics by In Labor Force | Age 30-34
Demographics Similar to Immigrants from Belize by In Labor Force | Age 30-34
In terms of in labor force | age 30-34, the demographic groups most similar to Immigrants from Belize are Cree (83.2%, a difference of 0.0%), Assyrian/Chaldean/Syriac (83.2%, a difference of 0.050%), Immigrants from Latin America (83.1%, a difference of 0.060%), Mexican American Indian (83.2%, a difference of 0.070%), and Samoan (83.3%, a difference of 0.10%).
| Demographics | Rating | Rank | In Labor Force | Age 30-34 |
| Delaware | 0.0 /100 | #277 | Tragic 83.5% |
| Fijians | 0.0 /100 | #278 | Tragic 83.4% |
| Immigrants | Fiji | 0.0 /100 | #279 | Tragic 83.4% |
| Africans | 0.0 /100 | #280 | Tragic 83.4% |
| Samoans | 0.0 /100 | #281 | Tragic 83.3% |
| Mexican American Indians | 0.0 /100 | #282 | Tragic 83.2% |
| Assyrians/Chaldeans/Syriacs | 0.0 /100 | #283 | Tragic 83.2% |
| Immigrants | Belize | 0.0 /100 | #284 | Tragic 83.2% |
| Cree | 0.0 /100 | #285 | Tragic 83.2% |
| Immigrants | Latin America | 0.0 /100 | #286 | Tragic 83.1% |
| Native Hawaiians | 0.0 /100 | #287 | Tragic 83.0% |
| Central American Indians | 0.0 /100 | #288 | Tragic 83.0% |
| Hawaiians | 0.0 /100 | #289 | Tragic 83.0% |
| Blackfeet | 0.0 /100 | #290 | Tragic 82.8% |
| Potawatomi | 0.0 /100 | #291 | Tragic 82.8% |
Demographics Similar to Chileans by In Labor Force | Age 30-34
In terms of in labor force | age 30-34, the demographic groups most similar to Chileans are Immigrants from Indonesia (84.9%, a difference of 0.010%), Immigrants from Vietnam (85.0%, a difference of 0.020%), Bhutanese (85.0%, a difference of 0.030%), South African (85.0%, a difference of 0.040%), and Sri Lankan (85.0%, a difference of 0.040%).
| Demographics | Rating | Rank | In Labor Force | Age 30-34 |
| Immigrants | Chile | 89.2 /100 | #134 | Excellent 85.0% |
| Immigrants | Asia | 88.9 /100 | #135 | Excellent 85.0% |
| Jordanians | 88.6 /100 | #136 | Excellent 85.0% |
| South Africans | 88.0 /100 | #137 | Excellent 85.0% |
| Sri Lankans | 87.8 /100 | #138 | Excellent 85.0% |
| Bhutanese | 87.5 /100 | #139 | Excellent 85.0% |
| Immigrants | Vietnam | 86.5 /100 | #140 | Excellent 85.0% |
| Chileans | 85.3 /100 | #141 | Excellent 84.9% |
| Immigrants | Indonesia | 84.3 /100 | #142 | Excellent 84.9% |
| Colombians | 82.2 /100 | #143 | Excellent 84.9% |
| Uruguayans | 78.5 /100 | #144 | Good 84.9% |
| Palestinians | 77.7 /100 | #145 | Good 84.9% |
| Immigrants | Saudi Arabia | 76.6 /100 | #146 | Good 84.9% |
| Immigrants | Colombia | 76.3 /100 | #147 | Good 84.9% |
| Immigrants | Pakistan | 76.2 /100 | #148 | Good 84.9% |