Liberian vs Palestinian In Labor Force | Age > 16
COMPARE
Liberian
Palestinian
In Labor Force | Age > 16
In Labor Force | Age > 16 Comparison
Liberians
Palestinians
67.8%
IN LABOR FORCE | AGE > 16
100.0/ 100
METRIC RATING
14th/ 347
METRIC RANK
65.9%
IN LABOR FORCE | AGE > 16
98.5/ 100
METRIC RATING
104th/ 347
METRIC RANK
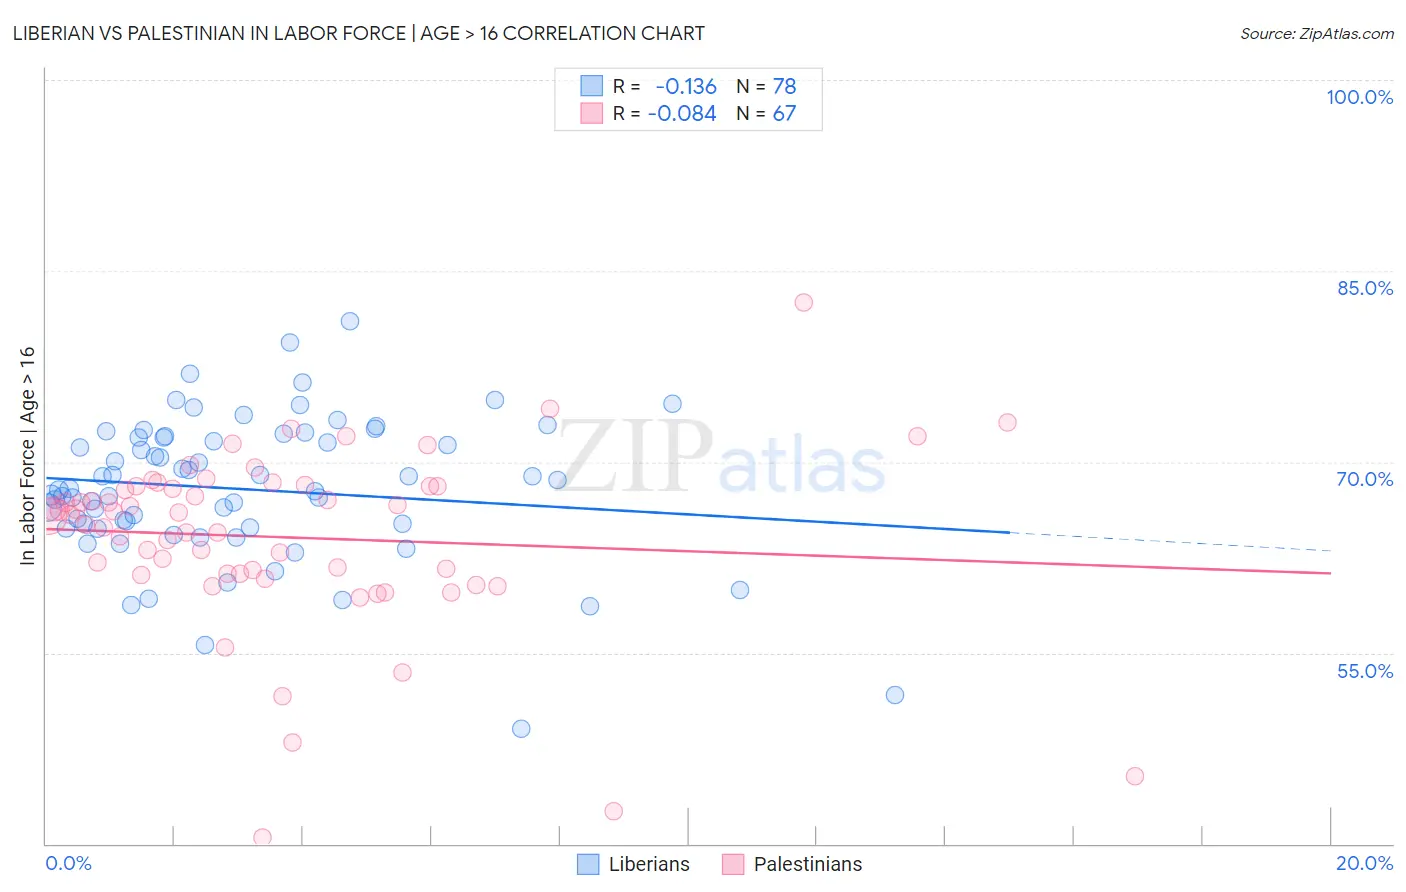
Liberian vs Palestinian In Labor Force | Age > 16 Correlation Chart
The statistical analysis conducted on geographies consisting of 118,097,222 people shows a poor negative correlation between the proportion of Liberians and labor force participation rate among population ages 16 and over in the United States with a correlation coefficient (R) of -0.136 and weighted average of 67.8%. Similarly, the statistical analysis conducted on geographies consisting of 216,467,324 people shows a slight negative correlation between the proportion of Palestinians and labor force participation rate among population ages 16 and over in the United States with a correlation coefficient (R) of -0.084 and weighted average of 65.9%, a difference of 2.9%.
In Labor Force | Age > 16 Correlation Summary
| Measurement | Liberian | Palestinian |
| Minimum | 49.0% | 40.5% |
| Maximum | 81.0% | 82.5% |
| Range | 32.0% | 42.0% |
| Mean | 67.9% | 64.1% |
| Median | 67.8% | 65.8% |
| Interquartile 25% (IQ1) | 64.8% | 61.2% |
| Interquartile 75% (IQ3) | 71.9% | 68.1% |
| Interquartile Range (IQR) | 7.1% | 6.9% |
| Standard Deviation (Sample) | 5.7% | 7.1% |
| Standard Deviation (Population) | 5.6% | 7.0% |
Similar Demographics by In Labor Force | Age > 16
Demographics Similar to Liberians by In Labor Force | Age > 16
In terms of in labor force | age > 16, the demographic groups most similar to Liberians are Immigrants from Middle Africa (67.7%, a difference of 0.050%), Immigrants from Sudan (67.7%, a difference of 0.16%), Immigrants from India (67.6%, a difference of 0.24%), Immigrants from Liberia (67.6%, a difference of 0.25%), and Kenyan (67.6%, a difference of 0.29%).
| Demographics | Rating | Rank | In Labor Force | Age > 16 |
| Immigrants | Cameroon | 100.0 /100 | #7 | Exceptional 68.7% |
| Immigrants | Sierra Leone | 100.0 /100 | #8 | Exceptional 68.5% |
| Immigrants | Eastern Africa | 100.0 /100 | #9 | Exceptional 68.5% |
| Immigrants | Bolivia | 100.0 /100 | #10 | Exceptional 68.4% |
| Bolivians | 100.0 /100 | #11 | Exceptional 68.2% |
| Sudanese | 100.0 /100 | #12 | Exceptional 68.0% |
| Immigrants | Nepal | 100.0 /100 | #13 | Exceptional 68.0% |
| Liberians | 100.0 /100 | #14 | Exceptional 67.8% |
| Immigrants | Middle Africa | 100.0 /100 | #15 | Exceptional 67.7% |
| Immigrants | Sudan | 100.0 /100 | #16 | Exceptional 67.7% |
| Immigrants | India | 100.0 /100 | #17 | Exceptional 67.6% |
| Immigrants | Liberia | 100.0 /100 | #18 | Exceptional 67.6% |
| Kenyans | 100.0 /100 | #19 | Exceptional 67.6% |
| Immigrants | Kenya | 100.0 /100 | #20 | Exceptional 67.6% |
| Tongans | 100.0 /100 | #21 | Exceptional 67.5% |
Demographics Similar to Palestinians by In Labor Force | Age > 16
In terms of in labor force | age > 16, the demographic groups most similar to Palestinians are Immigrants from South Eastern Asia (65.9%, a difference of 0.010%), Colombian (65.9%, a difference of 0.010%), Immigrants from Colombia (65.9%, a difference of 0.030%), Uruguayan (65.9%, a difference of 0.030%), and Immigrants from Australia (65.9%, a difference of 0.040%).
| Demographics | Rating | Rank | In Labor Force | Age > 16 |
| Filipinos | 98.9 /100 | #97 | Exceptional 65.9% |
| Immigrants | Chile | 98.7 /100 | #98 | Exceptional 65.9% |
| Immigrants | Australia | 98.7 /100 | #99 | Exceptional 65.9% |
| Okinawans | 98.7 /100 | #100 | Exceptional 65.9% |
| Immigrants | Colombia | 98.6 /100 | #101 | Exceptional 65.9% |
| Uruguayans | 98.6 /100 | #102 | Exceptional 65.9% |
| Immigrants | South Eastern Asia | 98.5 /100 | #103 | Exceptional 65.9% |
| Palestinians | 98.5 /100 | #104 | Exceptional 65.9% |
| Colombians | 98.4 /100 | #105 | Exceptional 65.9% |
| Immigrants | Serbia | 98.1 /100 | #106 | Exceptional 65.8% |
| Immigrants | Poland | 98.1 /100 | #107 | Exceptional 65.8% |
| Immigrants | Spain | 98.0 /100 | #108 | Exceptional 65.8% |
| Immigrants | Japan | 98.0 /100 | #109 | Exceptional 65.8% |
| Japanese | 97.7 /100 | #110 | Exceptional 65.8% |
| Immigrants | Honduras | 97.5 /100 | #111 | Exceptional 65.8% |