Hopi vs Palestinian In Labor Force | Age > 16
COMPARE
Hopi
Palestinian
In Labor Force | Age > 16
In Labor Force | Age > 16 Comparison
Hopi
Palestinians
58.4%
IN LABOR FORCE | AGE > 16
0.0/ 100
METRIC RATING
341st/ 347
METRIC RANK
65.9%
IN LABOR FORCE | AGE > 16
98.5/ 100
METRIC RATING
104th/ 347
METRIC RANK
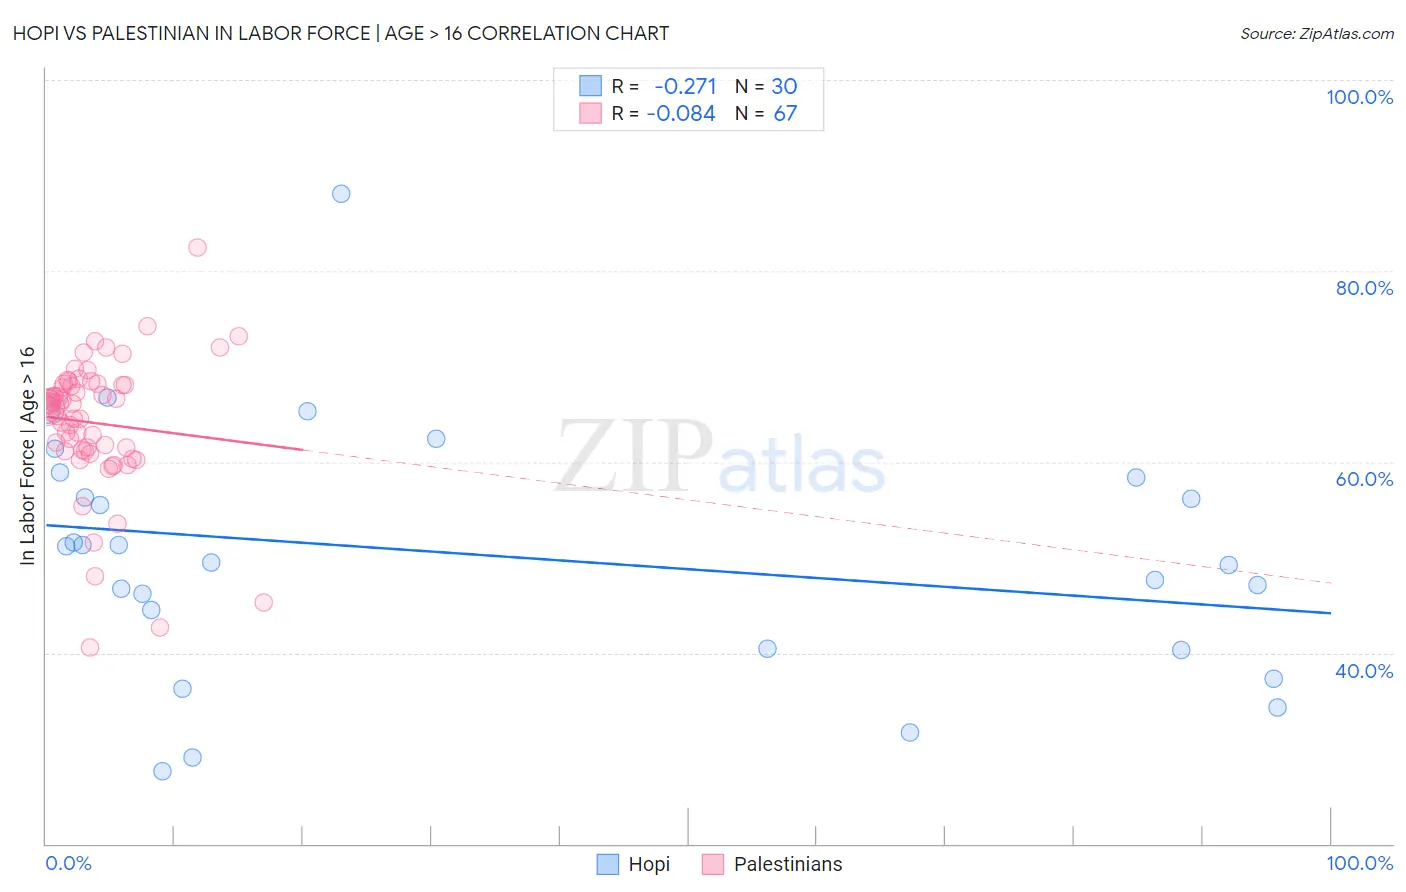
Hopi vs Palestinian In Labor Force | Age > 16 Correlation Chart
The statistical analysis conducted on geographies consisting of 74,733,532 people shows a weak negative correlation between the proportion of Hopi and labor force participation rate among population ages 16 and over in the United States with a correlation coefficient (R) of -0.271 and weighted average of 58.4%. Similarly, the statistical analysis conducted on geographies consisting of 216,467,324 people shows a slight negative correlation between the proportion of Palestinians and labor force participation rate among population ages 16 and over in the United States with a correlation coefficient (R) of -0.084 and weighted average of 65.9%, a difference of 12.8%.
In Labor Force | Age > 16 Correlation Summary
| Measurement | Hopi | Palestinian |
| Minimum | 27.6% | 40.5% |
| Maximum | 88.1% | 82.5% |
| Range | 60.5% | 42.0% |
| Mean | 50.2% | 64.1% |
| Median | 50.4% | 65.8% |
| Interquartile 25% (IQ1) | 40.4% | 61.2% |
| Interquartile 75% (IQ3) | 58.3% | 68.1% |
| Interquartile Range (IQR) | 17.9% | 6.9% |
| Standard Deviation (Sample) | 13.0% | 7.1% |
| Standard Deviation (Population) | 12.8% | 7.0% |
Similar Demographics by In Labor Force | Age > 16
Demographics Similar to Hopi by In Labor Force | Age > 16
In terms of in labor force | age > 16, the demographic groups most similar to Hopi are Puerto Rican (58.1%, a difference of 0.47%), Yuman (57.8%, a difference of 0.99%), Pueblo (59.3%, a difference of 1.5%), Pima (57.4%, a difference of 1.7%), and Houma (59.5%, a difference of 1.9%).
| Demographics | Rating | Rank | In Labor Force | Age > 16 |
| Paiute | 0.0 /100 | #333 | Tragic 60.7% |
| Apache | 0.0 /100 | #334 | Tragic 60.7% |
| Natives/Alaskans | 0.0 /100 | #335 | Tragic 60.6% |
| Menominee | 0.0 /100 | #336 | Tragic 60.6% |
| Colville | 0.0 /100 | #337 | Tragic 59.8% |
| Immigrants | Yemen | 0.0 /100 | #338 | Tragic 59.6% |
| Houma | 0.0 /100 | #339 | Tragic 59.5% |
| Pueblo | 0.0 /100 | #340 | Tragic 59.3% |
| Hopi | 0.0 /100 | #341 | Tragic 58.4% |
| Puerto Ricans | 0.0 /100 | #342 | Tragic 58.1% |
| Yuman | 0.0 /100 | #343 | Tragic 57.8% |
| Pima | 0.0 /100 | #344 | Tragic 57.4% |
| Tohono O'odham | 0.0 /100 | #345 | Tragic 57.2% |
| Lumbee | 0.0 /100 | #346 | Tragic 56.8% |
| Navajo | 0.0 /100 | #347 | Tragic 56.6% |
Demographics Similar to Palestinians by In Labor Force | Age > 16
In terms of in labor force | age > 16, the demographic groups most similar to Palestinians are Immigrants from South Eastern Asia (65.9%, a difference of 0.010%), Colombian (65.9%, a difference of 0.010%), Immigrants from Colombia (65.9%, a difference of 0.030%), Uruguayan (65.9%, a difference of 0.030%), and Immigrants from Australia (65.9%, a difference of 0.040%).
| Demographics | Rating | Rank | In Labor Force | Age > 16 |
| Filipinos | 98.9 /100 | #97 | Exceptional 65.9% |
| Immigrants | Chile | 98.7 /100 | #98 | Exceptional 65.9% |
| Immigrants | Australia | 98.7 /100 | #99 | Exceptional 65.9% |
| Okinawans | 98.7 /100 | #100 | Exceptional 65.9% |
| Immigrants | Colombia | 98.6 /100 | #101 | Exceptional 65.9% |
| Uruguayans | 98.6 /100 | #102 | Exceptional 65.9% |
| Immigrants | South Eastern Asia | 98.5 /100 | #103 | Exceptional 65.9% |
| Palestinians | 98.5 /100 | #104 | Exceptional 65.9% |
| Colombians | 98.4 /100 | #105 | Exceptional 65.9% |
| Immigrants | Serbia | 98.1 /100 | #106 | Exceptional 65.8% |
| Immigrants | Poland | 98.1 /100 | #107 | Exceptional 65.8% |
| Immigrants | Spain | 98.0 /100 | #108 | Exceptional 65.8% |
| Immigrants | Japan | 98.0 /100 | #109 | Exceptional 65.8% |
| Japanese | 97.7 /100 | #110 | Exceptional 65.8% |
| Immigrants | Honduras | 97.5 /100 | #111 | Exceptional 65.8% |