Seminole vs Lebanese Unemployment Among Women with Children Under 18 years
COMPARE
Seminole
Lebanese
Unemployment Among Women with Children Under 18 years
Unemployment Among Women with Children Under 18 years Comparison
Seminole
Lebanese
6.0%
UNEMPLOYMENT AMONG WOMEN WITH CHILDREN UNDER 18 YEARS
0.5/ 100
METRIC RATING
252nd/ 347
METRIC RANK
5.4%
UNEMPLOYMENT AMONG WOMEN WITH CHILDREN UNDER 18 YEARS
64.7/ 100
METRIC RATING
163rd/ 347
METRIC RANK
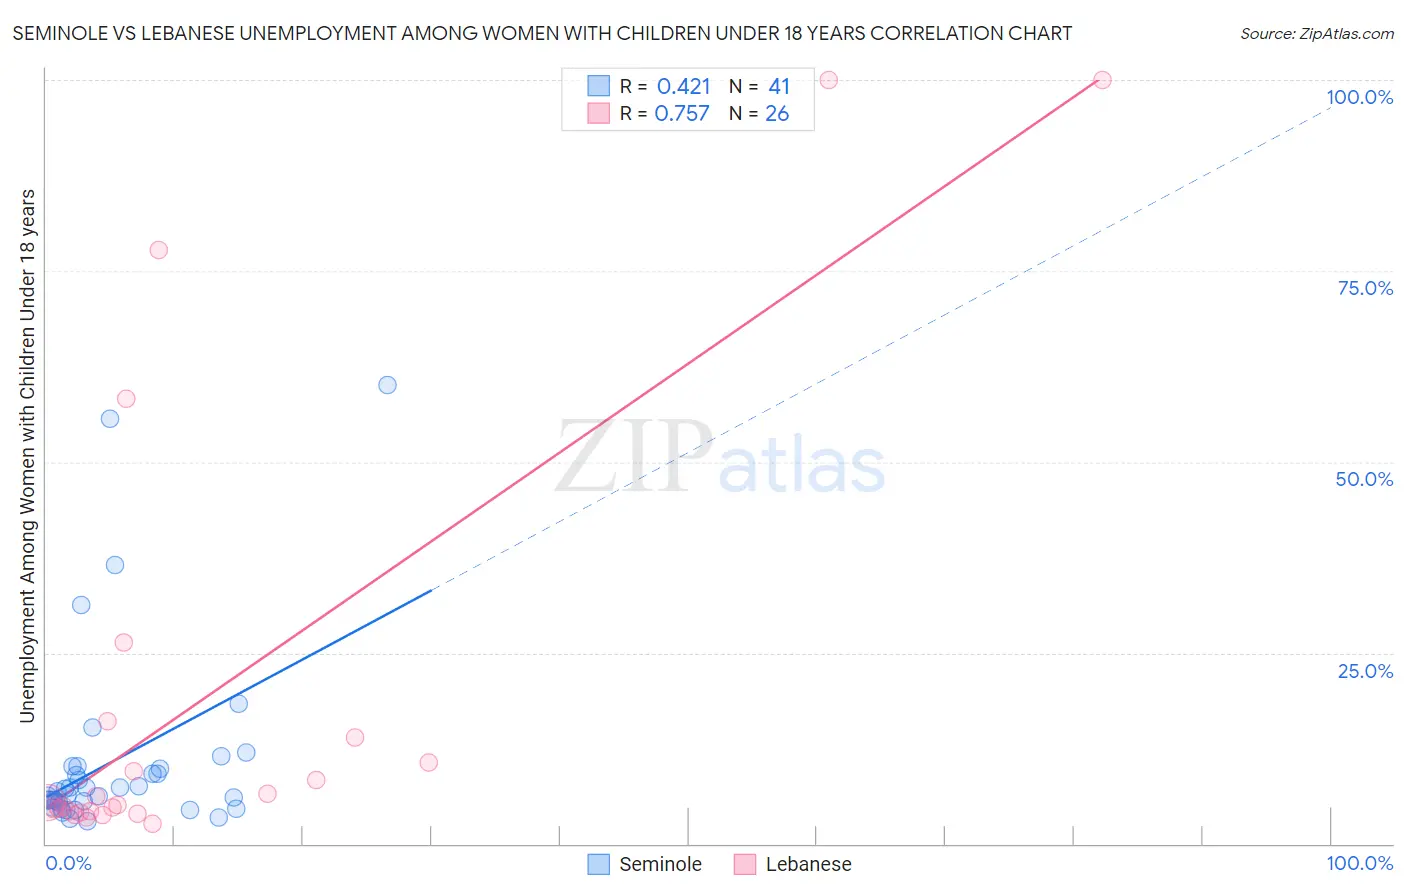
Seminole vs Lebanese Unemployment Among Women with Children Under 18 years Correlation Chart
The statistical analysis conducted on geographies consisting of 116,531,030 people shows a moderate positive correlation between the proportion of Seminole and unemployment rate among women with children under the age of 18 in the United States with a correlation coefficient (R) of 0.421 and weighted average of 6.0%. Similarly, the statistical analysis conducted on geographies consisting of 384,417,368 people shows a strong positive correlation between the proportion of Lebanese and unemployment rate among women with children under the age of 18 in the United States with a correlation coefficient (R) of 0.757 and weighted average of 5.4%, a difference of 10.6%.
Unemployment Among Women with Children Under 18 years Correlation Summary
| Measurement | Seminole | Lebanese |
| Minimum | 3.0% | 2.7% |
| Maximum | 60.0% | 100.0% |
| Range | 57.0% | 97.3% |
| Mean | 11.0% | 19.0% |
| Median | 6.9% | 5.2% |
| Interquartile 25% (IQ1) | 5.1% | 4.2% |
| Interquartile 75% (IQ3) | 9.9% | 13.9% |
| Interquartile Range (IQR) | 4.9% | 9.7% |
| Standard Deviation (Sample) | 12.6% | 29.6% |
| Standard Deviation (Population) | 12.5% | 29.0% |
Similar Demographics by Unemployment Among Women with Children Under 18 years
Demographics Similar to Seminole by Unemployment Among Women with Children Under 18 years
In terms of unemployment among women with children under 18 years, the demographic groups most similar to Seminole are Immigrants from Congo (6.0%, a difference of 0.21%), Ute (5.9%, a difference of 0.62%), Immigrants from Cabo Verde (5.9%, a difference of 0.63%), Immigrants from Cameroon (5.9%, a difference of 0.70%), and Delaware (5.9%, a difference of 0.85%).
| Demographics | Rating | Rank | Unemployment Among Women with Children Under 18 years |
| Ugandans | 1.1 /100 | #245 | Tragic 5.9% |
| Uruguayans | 1.0 /100 | #246 | Tragic 5.9% |
| Cape Verdeans | 1.0 /100 | #247 | Tragic 5.9% |
| Delaware | 0.8 /100 | #248 | Tragic 5.9% |
| Immigrants | Cameroon | 0.8 /100 | #249 | Tragic 5.9% |
| Immigrants | Cabo Verde | 0.7 /100 | #250 | Tragic 5.9% |
| Ute | 0.7 /100 | #251 | Tragic 5.9% |
| Seminole | 0.5 /100 | #252 | Tragic 6.0% |
| Immigrants | Congo | 0.4 /100 | #253 | Tragic 6.0% |
| Immigrants | Azores | 0.3 /100 | #254 | Tragic 6.0% |
| Liberians | 0.2 /100 | #255 | Tragic 6.0% |
| Nepalese | 0.2 /100 | #256 | Tragic 6.0% |
| Bermudans | 0.1 /100 | #257 | Tragic 6.1% |
| Immigrants | Nigeria | 0.1 /100 | #258 | Tragic 6.1% |
| Ottawa | 0.1 /100 | #259 | Tragic 6.1% |
Demographics Similar to Lebanese by Unemployment Among Women with Children Under 18 years
In terms of unemployment among women with children under 18 years, the demographic groups most similar to Lebanese are Immigrants from Saudi Arabia (5.4%, a difference of 0.030%), Immigrants from Iraq (5.4%, a difference of 0.10%), Celtic (5.4%, a difference of 0.13%), Afghan (5.4%, a difference of 0.15%), and Tlingit-Haida (5.4%, a difference of 0.22%).
| Demographics | Rating | Rank | Unemployment Among Women with Children Under 18 years |
| South Africans | 70.3 /100 | #156 | Good 5.4% |
| German Russians | 70.2 /100 | #157 | Good 5.4% |
| Immigrants | Burma/Myanmar | 69.5 /100 | #158 | Good 5.4% |
| Chickasaw | 68.4 /100 | #159 | Good 5.4% |
| Afghans | 66.6 /100 | #160 | Good 5.4% |
| Immigrants | Iraq | 65.9 /100 | #161 | Good 5.4% |
| Immigrants | Saudi Arabia | 65.0 /100 | #162 | Good 5.4% |
| Lebanese | 64.7 /100 | #163 | Good 5.4% |
| Celtics | 63.0 /100 | #164 | Good 5.4% |
| Tlingit-Haida | 61.9 /100 | #165 | Good 5.4% |
| Aleuts | 59.4 /100 | #166 | Average 5.4% |
| Immigrants | Denmark | 58.0 /100 | #167 | Average 5.4% |
| Immigrants | Northern Africa | 56.1 /100 | #168 | Average 5.4% |
| Immigrants | Thailand | 55.3 /100 | #169 | Average 5.4% |
| Samoans | 54.1 /100 | #170 | Average 5.4% |