Seminole vs Slovak In Labor Force | Age 20-64
COMPARE
Seminole
Slovak
In Labor Force | Age 20-64
In Labor Force | Age 20-64 Comparison
Seminole
Slovaks
75.5%
IN LABOR FORCE | AGE 20-64
0.0/ 100
METRIC RATING
321st/ 347
METRIC RANK
79.8%
IN LABOR FORCE | AGE 20-64
79.9/ 100
METRIC RATING
142nd/ 347
METRIC RANK
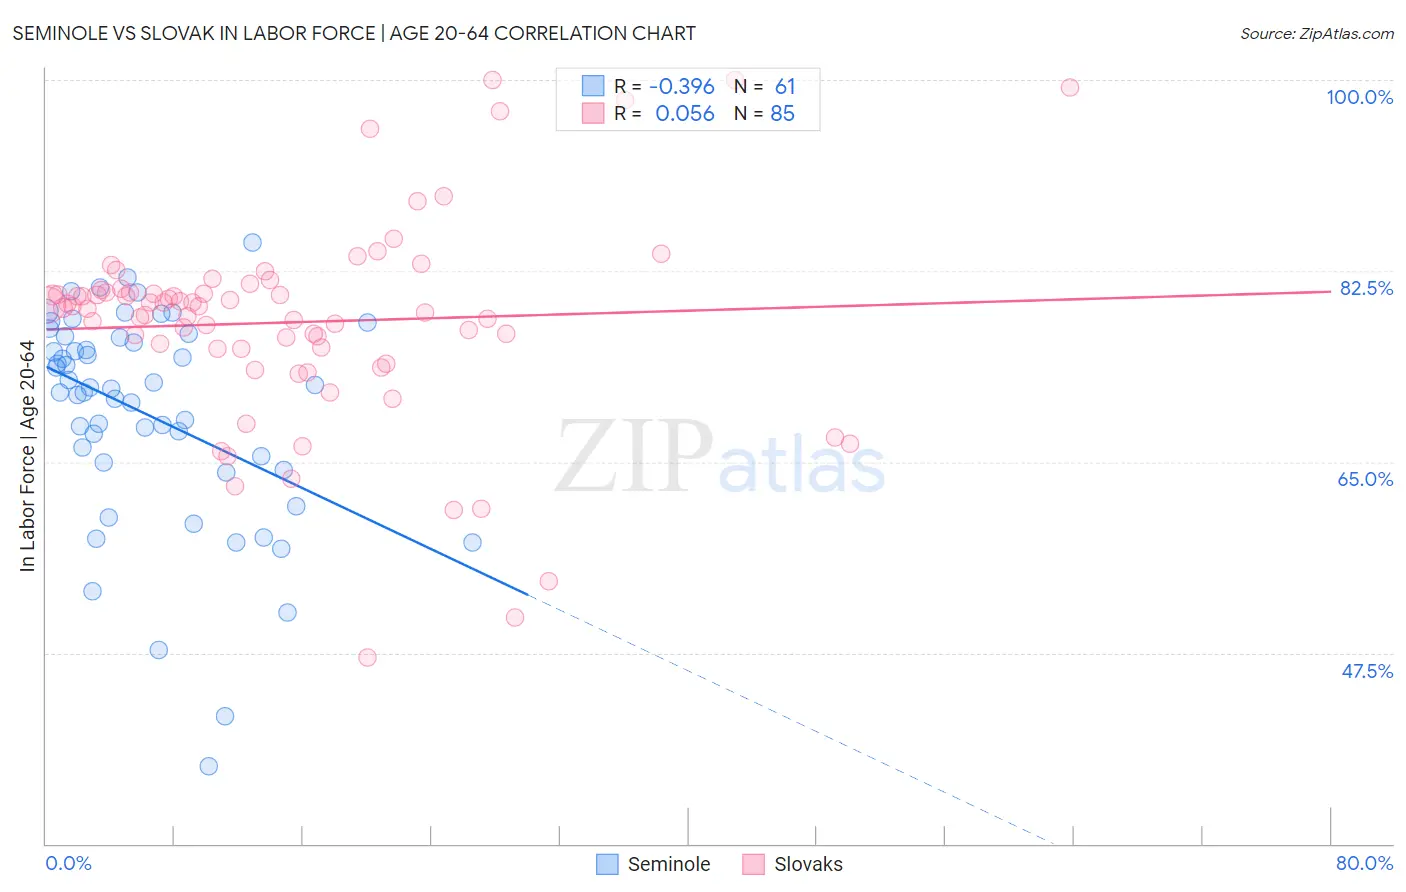
Seminole vs Slovak In Labor Force | Age 20-64 Correlation Chart
The statistical analysis conducted on geographies consisting of 118,311,145 people shows a mild negative correlation between the proportion of Seminole and labor force participation rate among population between the ages 20 and 64 in the United States with a correlation coefficient (R) of -0.396 and weighted average of 75.5%. Similarly, the statistical analysis conducted on geographies consisting of 397,893,595 people shows a slight positive correlation between the proportion of Slovaks and labor force participation rate among population between the ages 20 and 64 in the United States with a correlation coefficient (R) of 0.056 and weighted average of 79.8%, a difference of 5.6%.
In Labor Force | Age 20-64 Correlation Summary
| Measurement | Seminole | Slovak |
| Minimum | 37.1% | 47.1% |
| Maximum | 85.1% | 100.0% |
| Range | 48.0% | 52.9% |
| Mean | 69.3% | 77.8% |
| Median | 71.7% | 79.2% |
| Interquartile 25% (IQ1) | 64.5% | 75.3% |
| Interquartile 75% (IQ3) | 76.5% | 80.7% |
| Interquartile Range (IQR) | 11.9% | 5.4% |
| Standard Deviation (Sample) | 9.9% | 9.4% |
| Standard Deviation (Population) | 9.8% | 9.4% |
Similar Demographics by In Labor Force | Age 20-64
Demographics Similar to Seminole by In Labor Force | Age 20-64
In terms of in labor force | age 20-64, the demographic groups most similar to Seminole are Dutch West Indian (75.5%, a difference of 0.050%), Cajun (75.5%, a difference of 0.090%), Choctaw (75.4%, a difference of 0.14%), Menominee (75.3%, a difference of 0.28%), and Yakama (75.8%, a difference of 0.35%).
| Demographics | Rating | Rank | In Labor Force | Age 20-64 |
| Blacks/African Americans | 0.0 /100 | #314 | Tragic 76.8% |
| Ottawa | 0.0 /100 | #315 | Tragic 76.7% |
| Yaqui | 0.0 /100 | #316 | Tragic 76.5% |
| Cherokee | 0.0 /100 | #317 | Tragic 76.2% |
| Chickasaw | 0.0 /100 | #318 | Tragic 76.2% |
| Inupiat | 0.0 /100 | #319 | Tragic 76.1% |
| Yakama | 0.0 /100 | #320 | Tragic 75.8% |
| Seminole | 0.0 /100 | #321 | Tragic 75.5% |
| Dutch West Indians | 0.0 /100 | #322 | Tragic 75.5% |
| Cajuns | 0.0 /100 | #323 | Tragic 75.5% |
| Choctaw | 0.0 /100 | #324 | Tragic 75.4% |
| Menominee | 0.0 /100 | #325 | Tragic 75.3% |
| Creek | 0.0 /100 | #326 | Tragic 75.1% |
| Sioux | 0.0 /100 | #327 | Tragic 75.0% |
| Kiowa | 0.0 /100 | #328 | Tragic 75.0% |
Demographics Similar to Slovaks by In Labor Force | Age 20-64
In terms of in labor force | age 20-64, the demographic groups most similar to Slovaks are Immigrants from Israel (79.8%, a difference of 0.0%), Immigrants from Sweden (79.8%, a difference of 0.0%), Korean (79.8%, a difference of 0.0%), Immigrants from South Eastern Asia (79.8%, a difference of 0.010%), and Pakistani (79.8%, a difference of 0.010%).
| Demographics | Rating | Rank | In Labor Force | Age 20-64 |
| Ukrainians | 86.8 /100 | #135 | Excellent 79.9% |
| Immigrants | Singapore | 86.7 /100 | #136 | Excellent 79.9% |
| Immigrants | Ukraine | 86.5 /100 | #137 | Excellent 79.9% |
| Immigrants | Nigeria | 86.4 /100 | #138 | Excellent 79.9% |
| Immigrants | Spain | 83.9 /100 | #139 | Excellent 79.8% |
| Immigrants | South Eastern Asia | 80.4 /100 | #140 | Excellent 79.8% |
| Immigrants | Israel | 80.0 /100 | #141 | Good 79.8% |
| Slovaks | 79.9 /100 | #142 | Good 79.8% |
| Immigrants | Sweden | 79.7 /100 | #143 | Good 79.8% |
| Koreans | 79.6 /100 | #144 | Good 79.8% |
| Pakistanis | 79.3 /100 | #145 | Good 79.8% |
| Immigrants | Southern Europe | 78.9 /100 | #146 | Good 79.8% |
| Immigrants | Philippines | 78.0 /100 | #147 | Good 79.8% |
| Romanians | 77.6 /100 | #148 | Good 79.8% |
| Icelanders | 75.1 /100 | #149 | Good 79.7% |