Seminole vs Immigrants from Grenada In Labor Force | Age 20-64
COMPARE
Seminole
Immigrants from Grenada
In Labor Force | Age 20-64
In Labor Force | Age 20-64 Comparison
Seminole
Immigrants from Grenada
75.5%
IN LABOR FORCE | AGE 20-64
0.0/ 100
METRIC RATING
321st/ 347
METRIC RANK
77.7%
IN LABOR FORCE | AGE 20-64
0.0/ 100
METRIC RATING
295th/ 347
METRIC RANK
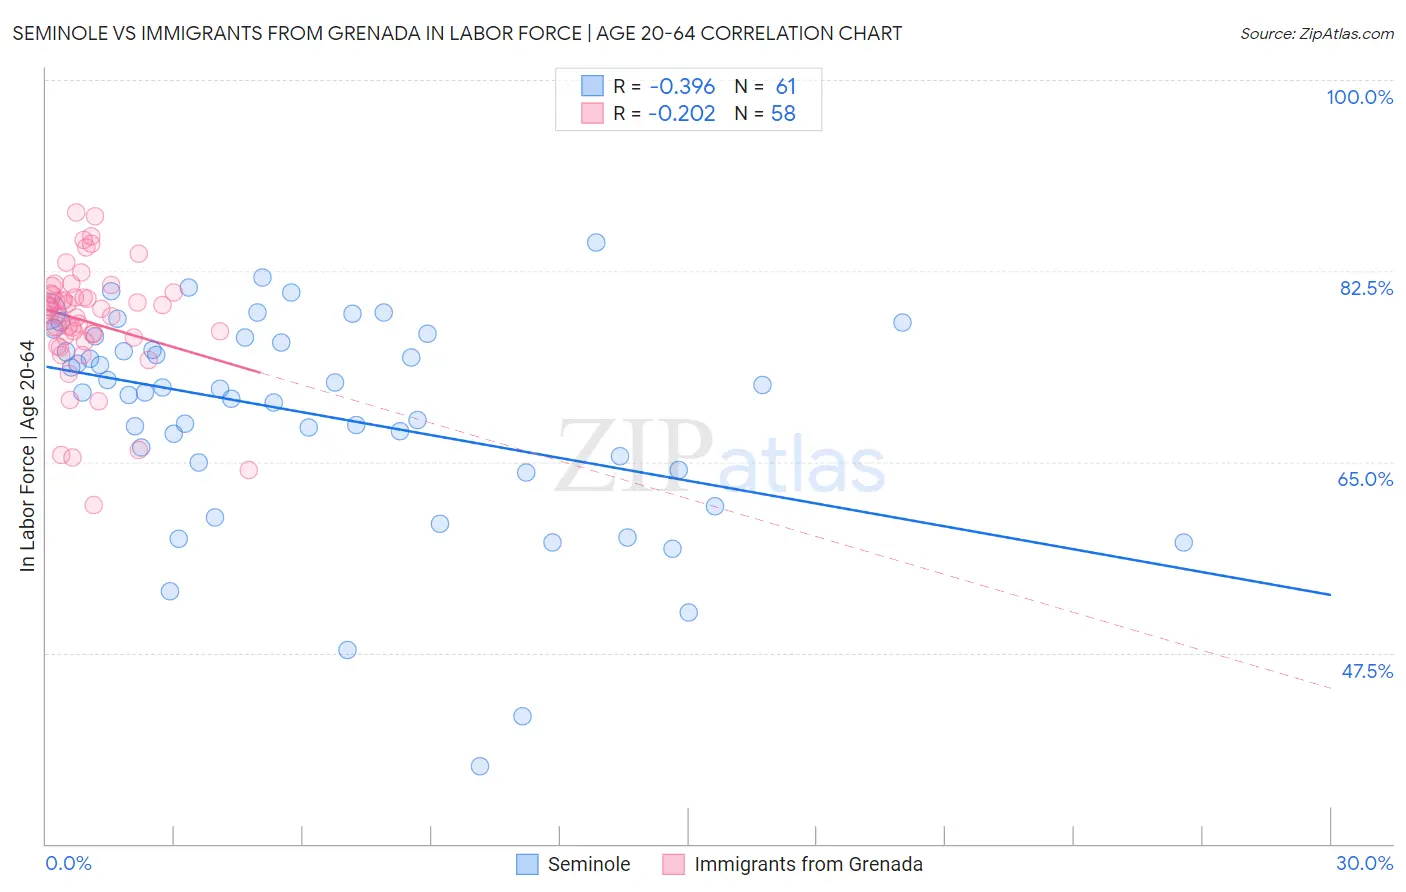
Seminole vs Immigrants from Grenada In Labor Force | Age 20-64 Correlation Chart
The statistical analysis conducted on geographies consisting of 118,311,145 people shows a mild negative correlation between the proportion of Seminole and labor force participation rate among population between the ages 20 and 64 in the United States with a correlation coefficient (R) of -0.396 and weighted average of 75.5%. Similarly, the statistical analysis conducted on geographies consisting of 67,201,096 people shows a weak negative correlation between the proportion of Immigrants from Grenada and labor force participation rate among population between the ages 20 and 64 in the United States with a correlation coefficient (R) of -0.202 and weighted average of 77.7%, a difference of 2.9%.
In Labor Force | Age 20-64 Correlation Summary
| Measurement | Seminole | Immigrants from Grenada |
| Minimum | 37.1% | 61.1% |
| Maximum | 85.1% | 87.9% |
| Range | 48.0% | 26.8% |
| Mean | 69.3% | 77.9% |
| Median | 71.7% | 78.8% |
| Interquartile 25% (IQ1) | 64.5% | 76.4% |
| Interquartile 75% (IQ3) | 76.5% | 80.4% |
| Interquartile Range (IQR) | 11.9% | 4.0% |
| Standard Deviation (Sample) | 9.9% | 5.4% |
| Standard Deviation (Population) | 9.8% | 5.4% |
Similar Demographics by In Labor Force | Age 20-64
Demographics Similar to Seminole by In Labor Force | Age 20-64
In terms of in labor force | age 20-64, the demographic groups most similar to Seminole are Dutch West Indian (75.5%, a difference of 0.050%), Cajun (75.5%, a difference of 0.090%), Choctaw (75.4%, a difference of 0.14%), Menominee (75.3%, a difference of 0.28%), and Yakama (75.8%, a difference of 0.35%).
| Demographics | Rating | Rank | In Labor Force | Age 20-64 |
| Blacks/African Americans | 0.0 /100 | #314 | Tragic 76.8% |
| Ottawa | 0.0 /100 | #315 | Tragic 76.7% |
| Yaqui | 0.0 /100 | #316 | Tragic 76.5% |
| Cherokee | 0.0 /100 | #317 | Tragic 76.2% |
| Chickasaw | 0.0 /100 | #318 | Tragic 76.2% |
| Inupiat | 0.0 /100 | #319 | Tragic 76.1% |
| Yakama | 0.0 /100 | #320 | Tragic 75.8% |
| Seminole | 0.0 /100 | #321 | Tragic 75.5% |
| Dutch West Indians | 0.0 /100 | #322 | Tragic 75.5% |
| Cajuns | 0.0 /100 | #323 | Tragic 75.5% |
| Choctaw | 0.0 /100 | #324 | Tragic 75.4% |
| Menominee | 0.0 /100 | #325 | Tragic 75.3% |
| Creek | 0.0 /100 | #326 | Tragic 75.1% |
| Sioux | 0.0 /100 | #327 | Tragic 75.0% |
| Kiowa | 0.0 /100 | #328 | Tragic 75.0% |
Demographics Similar to Immigrants from Grenada by In Labor Force | Age 20-64
In terms of in labor force | age 20-64, the demographic groups most similar to Immigrants from Grenada are Immigrants from Central America (77.7%, a difference of 0.030%), Immigrants from Dominican Republic (77.7%, a difference of 0.030%), Dominican (77.7%, a difference of 0.040%), Cree (77.7%, a difference of 0.050%), and Hispanic or Latino (77.6%, a difference of 0.11%).
| Demographics | Rating | Rank | In Labor Force | Age 20-64 |
| Hmong | 0.0 /100 | #288 | Tragic 77.9% |
| Africans | 0.0 /100 | #289 | Tragic 77.9% |
| Immigrants | Bangladesh | 0.0 /100 | #290 | Tragic 77.9% |
| Spanish Americans | 0.0 /100 | #291 | Tragic 77.8% |
| Immigrants | Azores | 0.0 /100 | #292 | Tragic 77.8% |
| Delaware | 0.0 /100 | #293 | Tragic 77.8% |
| Immigrants | Central America | 0.0 /100 | #294 | Tragic 77.7% |
| Immigrants | Grenada | 0.0 /100 | #295 | Tragic 77.7% |
| Immigrants | Dominican Republic | 0.0 /100 | #296 | Tragic 77.7% |
| Dominicans | 0.0 /100 | #297 | Tragic 77.7% |
| Cree | 0.0 /100 | #298 | Tragic 77.7% |
| Hispanics or Latinos | 0.0 /100 | #299 | Tragic 77.6% |
| Spanish American Indians | 0.0 /100 | #300 | Tragic 77.6% |
| Nepalese | 0.0 /100 | #301 | Tragic 77.5% |
| Iroquois | 0.0 /100 | #302 | Tragic 77.5% |