Maltese vs Paiute In Labor Force | Age 20-64
COMPARE
Maltese
Paiute
In Labor Force | Age 20-64
In Labor Force | Age 20-64 Comparison
Maltese
Paiute
80.0%
IN LABOR FORCE | AGE 20-64
92.4/ 100
METRIC RATING
120th/ 347
METRIC RANK
74.7%
IN LABOR FORCE | AGE 20-64
0.0/ 100
METRIC RATING
331st/ 347
METRIC RANK
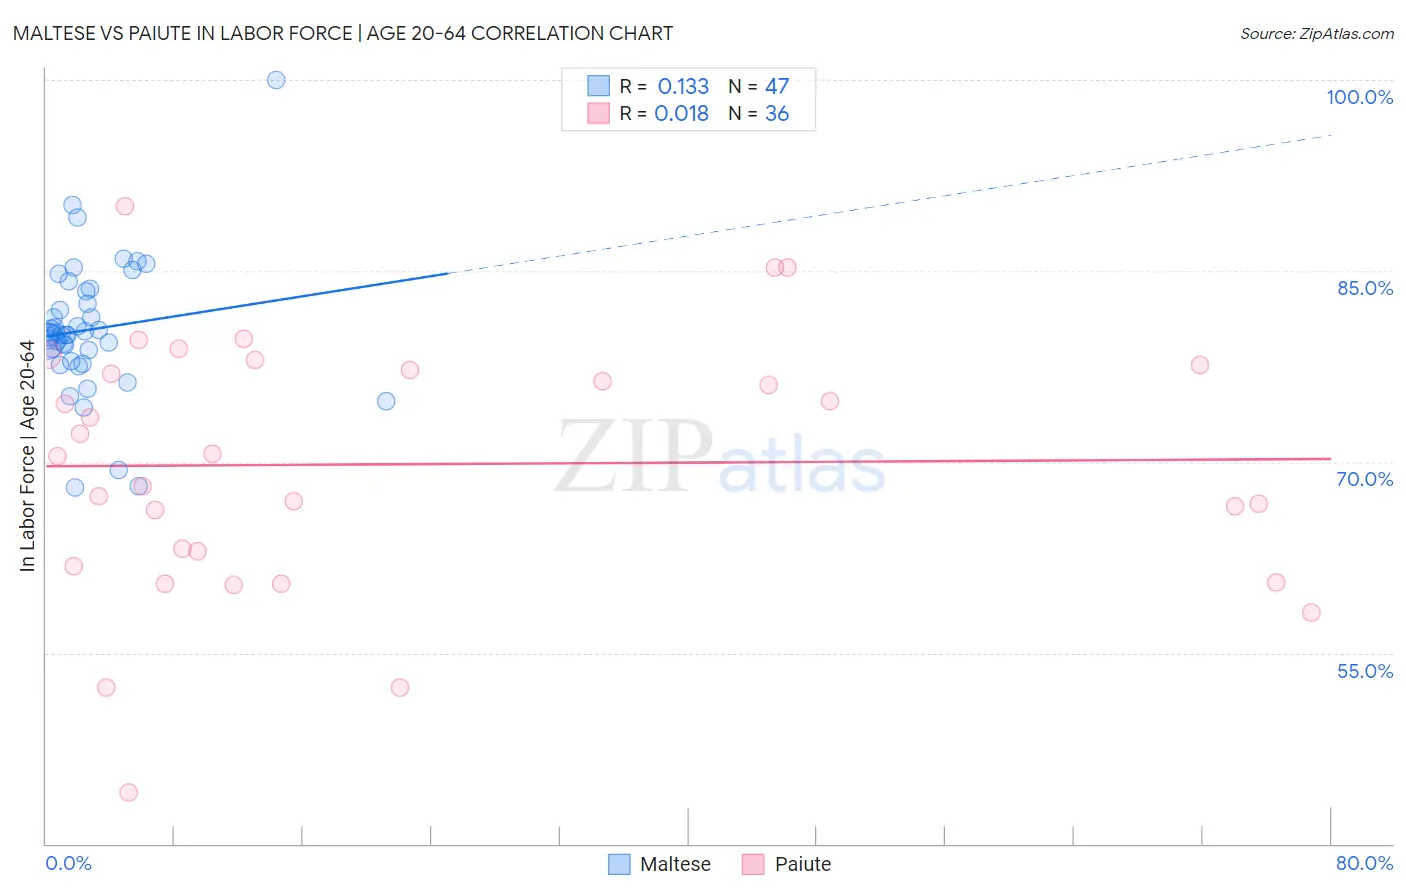
Maltese vs Paiute In Labor Force | Age 20-64 Correlation Chart
The statistical analysis conducted on geographies consisting of 126,477,906 people shows a poor positive correlation between the proportion of Maltese and labor force participation rate among population between the ages 20 and 64 in the United States with a correlation coefficient (R) of 0.133 and weighted average of 80.0%. Similarly, the statistical analysis conducted on geographies consisting of 58,399,197 people shows no correlation between the proportion of Paiute and labor force participation rate among population between the ages 20 and 64 in the United States with a correlation coefficient (R) of 0.018 and weighted average of 74.7%, a difference of 7.1%.
In Labor Force | Age 20-64 Correlation Summary
| Measurement | Maltese | Paiute |
| Minimum | 68.0% | 44.1% |
| Maximum | 100.0% | 90.1% |
| Range | 32.0% | 46.0% |
| Mean | 80.4% | 69.8% |
| Median | 79.9% | 70.5% |
| Interquartile 25% (IQ1) | 77.9% | 62.4% |
| Interquartile 75% (IQ3) | 83.4% | 77.4% |
| Interquartile Range (IQR) | 5.5% | 15.0% |
| Standard Deviation (Sample) | 5.4% | 10.1% |
| Standard Deviation (Population) | 5.4% | 10.0% |
Similar Demographics by In Labor Force | Age 20-64
Demographics Similar to Maltese by In Labor Force | Age 20-64
In terms of in labor force | age 20-64, the demographic groups most similar to Maltese are Immigrants from Taiwan (80.0%, a difference of 0.0%), Immigrants from Vietnam (80.0%, a difference of 0.010%), Cape Verdean (80.0%, a difference of 0.010%), Immigrants from Kuwait (80.0%, a difference of 0.010%), and Mongolian (79.9%, a difference of 0.010%).
| Demographics | Rating | Rank | In Labor Force | Age 20-64 |
| Sri Lankans | 93.9 /100 | #113 | Exceptional 80.0% |
| Argentineans | 93.8 /100 | #114 | Exceptional 80.0% |
| Bermudans | 93.3 /100 | #115 | Exceptional 80.0% |
| Immigrants | Western Africa | 93.1 /100 | #116 | Exceptional 80.0% |
| Immigrants | Vietnam | 92.7 /100 | #117 | Exceptional 80.0% |
| Cape Verdeans | 92.7 /100 | #118 | Exceptional 80.0% |
| Immigrants | Taiwan | 92.5 /100 | #119 | Exceptional 80.0% |
| Maltese | 92.4 /100 | #120 | Exceptional 80.0% |
| Immigrants | Kuwait | 92.2 /100 | #121 | Exceptional 80.0% |
| Mongolians | 92.0 /100 | #122 | Exceptional 79.9% |
| Immigrants | Russia | 91.8 /100 | #123 | Exceptional 79.9% |
| Immigrants | Europe | 91.6 /100 | #124 | Exceptional 79.9% |
| Danes | 91.5 /100 | #125 | Exceptional 79.9% |
| Immigrants | France | 90.7 /100 | #126 | Exceptional 79.9% |
| Immigrants | Czechoslovakia | 89.7 /100 | #127 | Excellent 79.9% |
Demographics Similar to Paiute by In Labor Force | Age 20-64
In terms of in labor force | age 20-64, the demographic groups most similar to Paiute are Colville (74.8%, a difference of 0.13%), Cheyenne (74.8%, a difference of 0.20%), Kiowa (75.0%, a difference of 0.40%), Arapaho (74.4%, a difference of 0.40%), and Sioux (75.0%, a difference of 0.43%).
| Demographics | Rating | Rank | In Labor Force | Age 20-64 |
| Choctaw | 0.0 /100 | #324 | Tragic 75.4% |
| Menominee | 0.0 /100 | #325 | Tragic 75.3% |
| Creek | 0.0 /100 | #326 | Tragic 75.1% |
| Sioux | 0.0 /100 | #327 | Tragic 75.0% |
| Kiowa | 0.0 /100 | #328 | Tragic 75.0% |
| Cheyenne | 0.0 /100 | #329 | Tragic 74.8% |
| Colville | 0.0 /100 | #330 | Tragic 74.8% |
| Paiute | 0.0 /100 | #331 | Tragic 74.7% |
| Arapaho | 0.0 /100 | #332 | Tragic 74.4% |
| Natives/Alaskans | 0.0 /100 | #333 | Tragic 73.9% |
| Apache | 0.0 /100 | #334 | Tragic 73.7% |
| Ute | 0.0 /100 | #335 | Tragic 73.7% |
| Crow | 0.0 /100 | #336 | Tragic 73.3% |
| Yup'ik | 0.0 /100 | #337 | Tragic 73.2% |
| Puerto Ricans | 0.0 /100 | #338 | Tragic 73.1% |