Immigrants from Congo vs Paiute In Labor Force | Age 20-64
COMPARE
Immigrants from Congo
Paiute
In Labor Force | Age 20-64
In Labor Force | Age 20-64 Comparison
Immigrants from Congo
Paiute
79.3%
IN LABOR FORCE | AGE 20-64
17.5/ 100
METRIC RATING
205th/ 347
METRIC RANK
74.7%
IN LABOR FORCE | AGE 20-64
0.0/ 100
METRIC RATING
331st/ 347
METRIC RANK
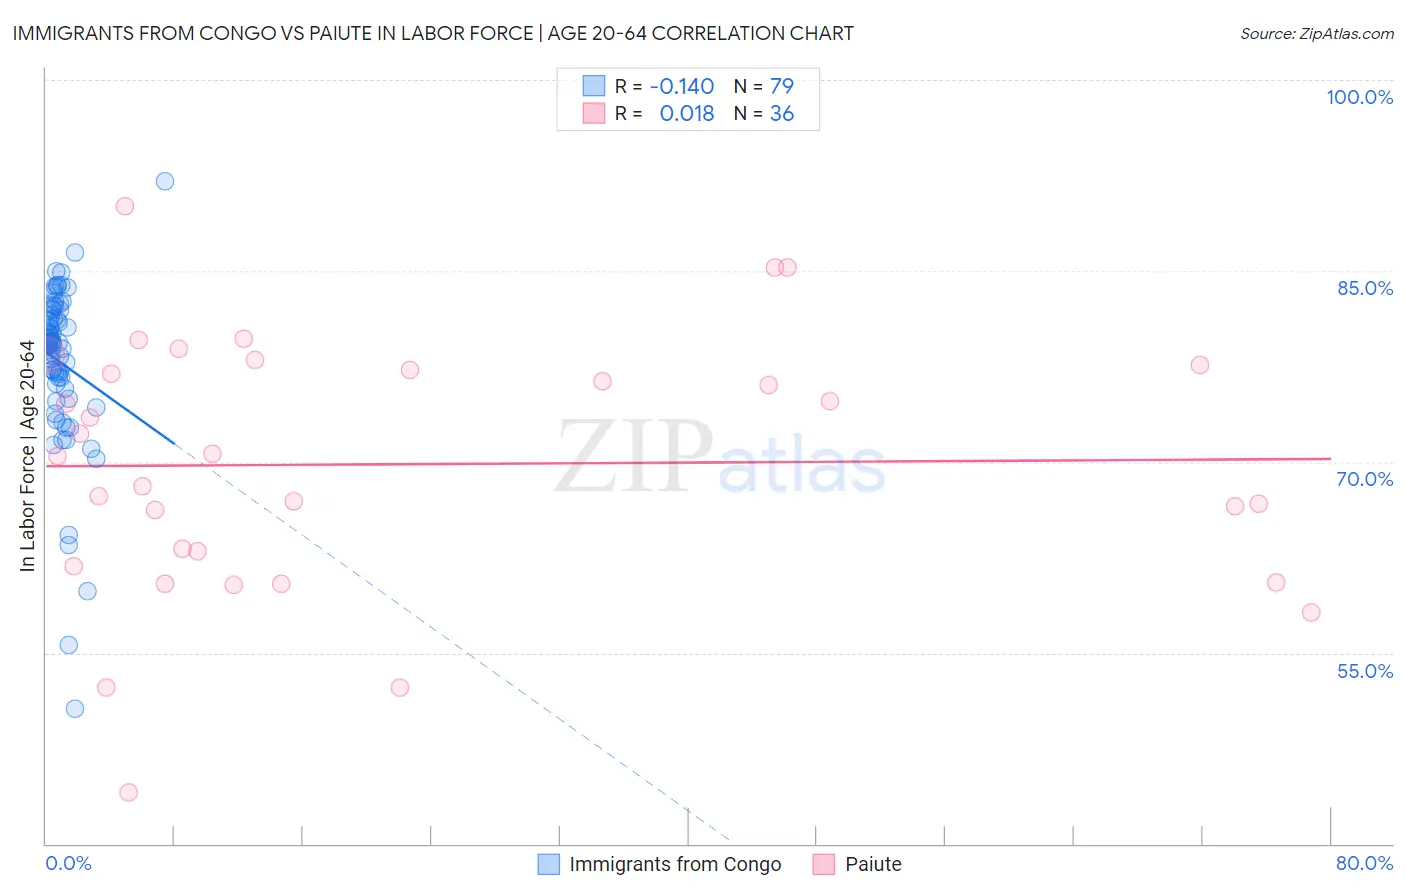
Immigrants from Congo vs Paiute In Labor Force | Age 20-64 Correlation Chart
The statistical analysis conducted on geographies consisting of 92,129,118 people shows a poor negative correlation between the proportion of Immigrants from Congo and labor force participation rate among population between the ages 20 and 64 in the United States with a correlation coefficient (R) of -0.140 and weighted average of 79.3%. Similarly, the statistical analysis conducted on geographies consisting of 58,399,197 people shows no correlation between the proportion of Paiute and labor force participation rate among population between the ages 20 and 64 in the United States with a correlation coefficient (R) of 0.018 and weighted average of 74.7%, a difference of 6.2%.
In Labor Force | Age 20-64 Correlation Summary
| Measurement | Immigrants from Congo | Paiute |
| Minimum | 50.6% | 44.1% |
| Maximum | 92.0% | 90.1% |
| Range | 41.4% | 46.0% |
| Mean | 77.8% | 69.8% |
| Median | 79.3% | 70.5% |
| Interquartile 25% (IQ1) | 76.1% | 62.4% |
| Interquartile 75% (IQ3) | 81.5% | 77.4% |
| Interquartile Range (IQR) | 5.4% | 15.0% |
| Standard Deviation (Sample) | 6.4% | 10.1% |
| Standard Deviation (Population) | 6.4% | 10.0% |
Similar Demographics by In Labor Force | Age 20-64
Demographics Similar to Immigrants from Congo by In Labor Force | Age 20-64
In terms of in labor force | age 20-64, the demographic groups most similar to Immigrants from Congo are Iraqi (79.3%, a difference of 0.0%), Immigrants from Cambodia (79.3%, a difference of 0.0%), Nicaraguan (79.3%, a difference of 0.010%), Immigrants from Ecuador (79.3%, a difference of 0.010%), and Subsaharan African (79.3%, a difference of 0.010%).
| Demographics | Rating | Rank | In Labor Force | Age 20-64 |
| Immigrants | Laos | 21.5 /100 | #198 | Fair 79.4% |
| Dutch | 20.2 /100 | #199 | Fair 79.3% |
| Immigrants | Oceania | 19.1 /100 | #200 | Poor 79.3% |
| Immigrants | Nicaragua | 19.0 /100 | #201 | Poor 79.3% |
| Nicaraguans | 18.3 /100 | #202 | Poor 79.3% |
| Iraqis | 17.7 /100 | #203 | Poor 79.3% |
| Immigrants | Cambodia | 17.6 /100 | #204 | Poor 79.3% |
| Immigrants | Congo | 17.5 /100 | #205 | Poor 79.3% |
| Immigrants | Ecuador | 16.9 /100 | #206 | Poor 79.3% |
| Sub-Saharan Africans | 16.5 /100 | #207 | Poor 79.3% |
| British | 16.5 /100 | #208 | Poor 79.3% |
| Bangladeshis | 16.4 /100 | #209 | Poor 79.3% |
| Haitians | 16.1 /100 | #210 | Poor 79.3% |
| Europeans | 15.3 /100 | #211 | Poor 79.3% |
| Irish | 13.2 /100 | #212 | Poor 79.3% |
Demographics Similar to Paiute by In Labor Force | Age 20-64
In terms of in labor force | age 20-64, the demographic groups most similar to Paiute are Colville (74.8%, a difference of 0.13%), Cheyenne (74.8%, a difference of 0.20%), Kiowa (75.0%, a difference of 0.40%), Arapaho (74.4%, a difference of 0.40%), and Sioux (75.0%, a difference of 0.43%).
| Demographics | Rating | Rank | In Labor Force | Age 20-64 |
| Choctaw | 0.0 /100 | #324 | Tragic 75.4% |
| Menominee | 0.0 /100 | #325 | Tragic 75.3% |
| Creek | 0.0 /100 | #326 | Tragic 75.1% |
| Sioux | 0.0 /100 | #327 | Tragic 75.0% |
| Kiowa | 0.0 /100 | #328 | Tragic 75.0% |
| Cheyenne | 0.0 /100 | #329 | Tragic 74.8% |
| Colville | 0.0 /100 | #330 | Tragic 74.8% |
| Paiute | 0.0 /100 | #331 | Tragic 74.7% |
| Arapaho | 0.0 /100 | #332 | Tragic 74.4% |
| Natives/Alaskans | 0.0 /100 | #333 | Tragic 73.9% |
| Apache | 0.0 /100 | #334 | Tragic 73.7% |
| Ute | 0.0 /100 | #335 | Tragic 73.7% |
| Crow | 0.0 /100 | #336 | Tragic 73.3% |
| Yup'ik | 0.0 /100 | #337 | Tragic 73.2% |
| Puerto Ricans | 0.0 /100 | #338 | Tragic 73.1% |