Hungarian vs Paiute In Labor Force | Age 20-64
COMPARE
Hungarian
Paiute
In Labor Force | Age 20-64
In Labor Force | Age 20-64 Comparison
Hungarians
Paiute
79.2%
IN LABOR FORCE | AGE 20-64
7.2/ 100
METRIC RATING
221st/ 347
METRIC RANK
74.7%
IN LABOR FORCE | AGE 20-64
0.0/ 100
METRIC RATING
331st/ 347
METRIC RANK
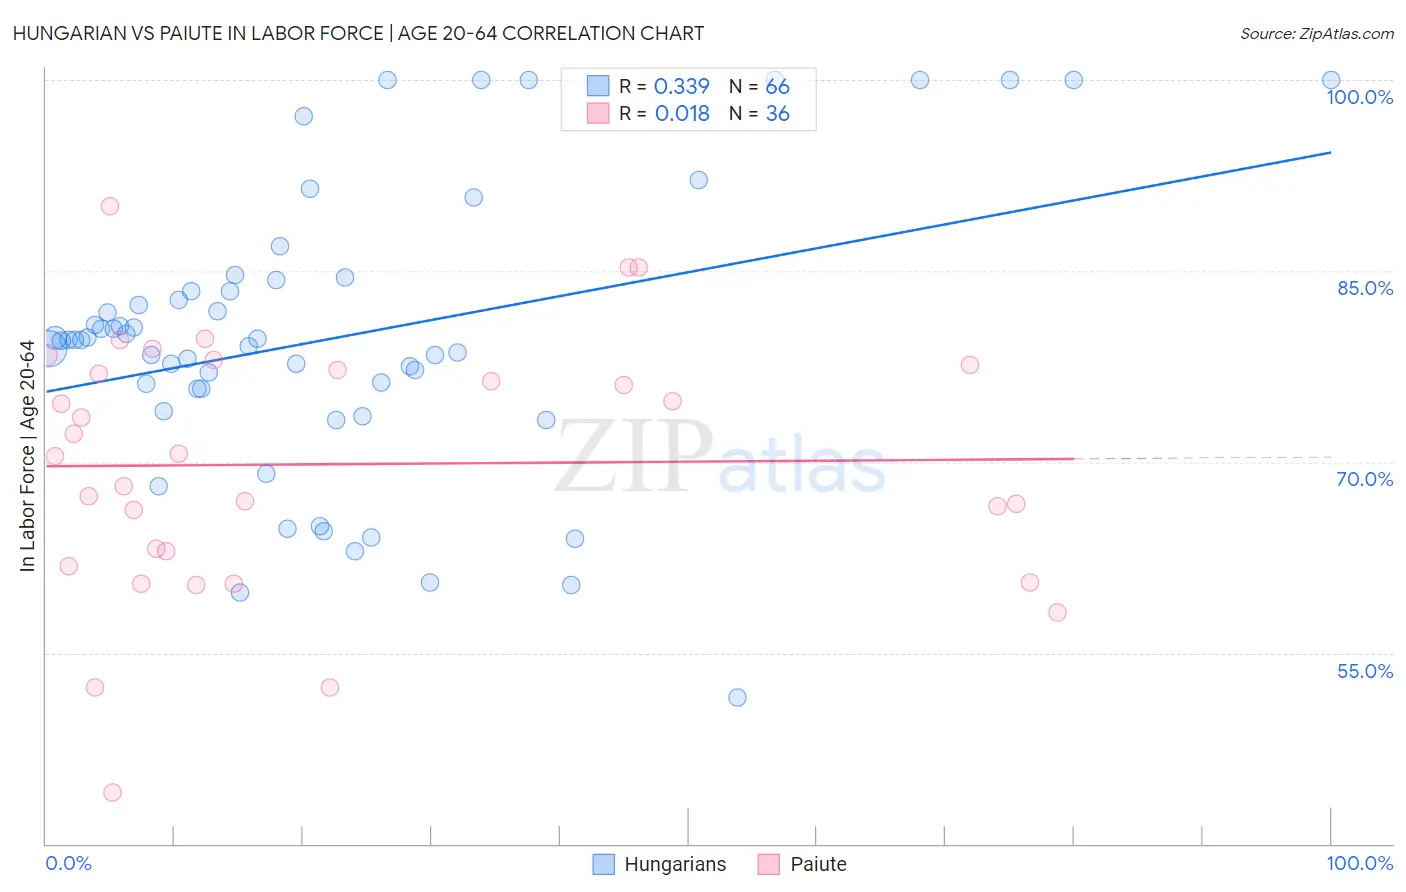
Hungarian vs Paiute In Labor Force | Age 20-64 Correlation Chart
The statistical analysis conducted on geographies consisting of 486,244,384 people shows a mild positive correlation between the proportion of Hungarians and labor force participation rate among population between the ages 20 and 64 in the United States with a correlation coefficient (R) of 0.339 and weighted average of 79.2%. Similarly, the statistical analysis conducted on geographies consisting of 58,399,197 people shows no correlation between the proportion of Paiute and labor force participation rate among population between the ages 20 and 64 in the United States with a correlation coefficient (R) of 0.018 and weighted average of 74.7%, a difference of 6.0%.
In Labor Force | Age 20-64 Correlation Summary
| Measurement | Hungarian | Paiute |
| Minimum | 51.5% | 44.1% |
| Maximum | 100.0% | 90.1% |
| Range | 48.5% | 46.0% |
| Mean | 79.7% | 69.8% |
| Median | 79.6% | 70.5% |
| Interquartile 25% (IQ1) | 75.8% | 62.4% |
| Interquartile 75% (IQ3) | 83.4% | 77.4% |
| Interquartile Range (IQR) | 7.6% | 15.0% |
| Standard Deviation (Sample) | 11.1% | 10.1% |
| Standard Deviation (Population) | 11.1% | 10.0% |
Similar Demographics by In Labor Force | Age 20-64
Demographics Similar to Hungarians by In Labor Force | Age 20-64
In terms of in labor force | age 20-64, the demographic groups most similar to Hungarians are Immigrants (79.2%, a difference of 0.010%), Immigrants from Panama (79.1%, a difference of 0.010%), Canadian (79.1%, a difference of 0.010%), Immigrants from Uzbekistan (79.1%, a difference of 0.010%), and French Canadian (79.2%, a difference of 0.030%).
| Demographics | Rating | Rank | In Labor Force | Age 20-64 |
| Immigrants | Armenia | 12.2 /100 | #214 | Poor 79.2% |
| Immigrants | Norway | 12.0 /100 | #215 | Poor 79.2% |
| Arabs | 11.4 /100 | #216 | Poor 79.2% |
| Immigrants | Western Asia | 11.0 /100 | #217 | Poor 79.2% |
| Immigrants | England | 9.3 /100 | #218 | Tragic 79.2% |
| French Canadians | 8.4 /100 | #219 | Tragic 79.2% |
| Immigrants | Immigrants | 7.7 /100 | #220 | Tragic 79.2% |
| Hungarians | 7.2 /100 | #221 | Tragic 79.2% |
| Immigrants | Panama | 6.9 /100 | #222 | Tragic 79.1% |
| Canadians | 6.8 /100 | #223 | Tragic 79.1% |
| Immigrants | Uzbekistan | 6.8 /100 | #224 | Tragic 79.1% |
| Portuguese | 6.4 /100 | #225 | Tragic 79.1% |
| Central Americans | 5.9 /100 | #226 | Tragic 79.1% |
| Immigrants | Western Europe | 5.9 /100 | #227 | Tragic 79.1% |
| Panamanians | 5.7 /100 | #228 | Tragic 79.1% |
Demographics Similar to Paiute by In Labor Force | Age 20-64
In terms of in labor force | age 20-64, the demographic groups most similar to Paiute are Colville (74.8%, a difference of 0.13%), Cheyenne (74.8%, a difference of 0.20%), Kiowa (75.0%, a difference of 0.40%), Arapaho (74.4%, a difference of 0.40%), and Sioux (75.0%, a difference of 0.43%).
| Demographics | Rating | Rank | In Labor Force | Age 20-64 |
| Choctaw | 0.0 /100 | #324 | Tragic 75.4% |
| Menominee | 0.0 /100 | #325 | Tragic 75.3% |
| Creek | 0.0 /100 | #326 | Tragic 75.1% |
| Sioux | 0.0 /100 | #327 | Tragic 75.0% |
| Kiowa | 0.0 /100 | #328 | Tragic 75.0% |
| Cheyenne | 0.0 /100 | #329 | Tragic 74.8% |
| Colville | 0.0 /100 | #330 | Tragic 74.8% |
| Paiute | 0.0 /100 | #331 | Tragic 74.7% |
| Arapaho | 0.0 /100 | #332 | Tragic 74.4% |
| Natives/Alaskans | 0.0 /100 | #333 | Tragic 73.9% |
| Apache | 0.0 /100 | #334 | Tragic 73.7% |
| Ute | 0.0 /100 | #335 | Tragic 73.7% |
| Crow | 0.0 /100 | #336 | Tragic 73.3% |
| Yup'ik | 0.0 /100 | #337 | Tragic 73.2% |
| Puerto Ricans | 0.0 /100 | #338 | Tragic 73.1% |