Russian vs Swiss In Labor Force | Age > 16
COMPARE
Russian
Swiss
In Labor Force | Age > 16
In Labor Force | Age > 16 Comparison
Russians
Swiss
64.9%
IN LABOR FORCE | AGE > 16
18.8/ 100
METRIC RATING
203rd/ 347
METRIC RANK
64.4%
IN LABOR FORCE | AGE > 16
2.1/ 100
METRIC RATING
247th/ 347
METRIC RANK
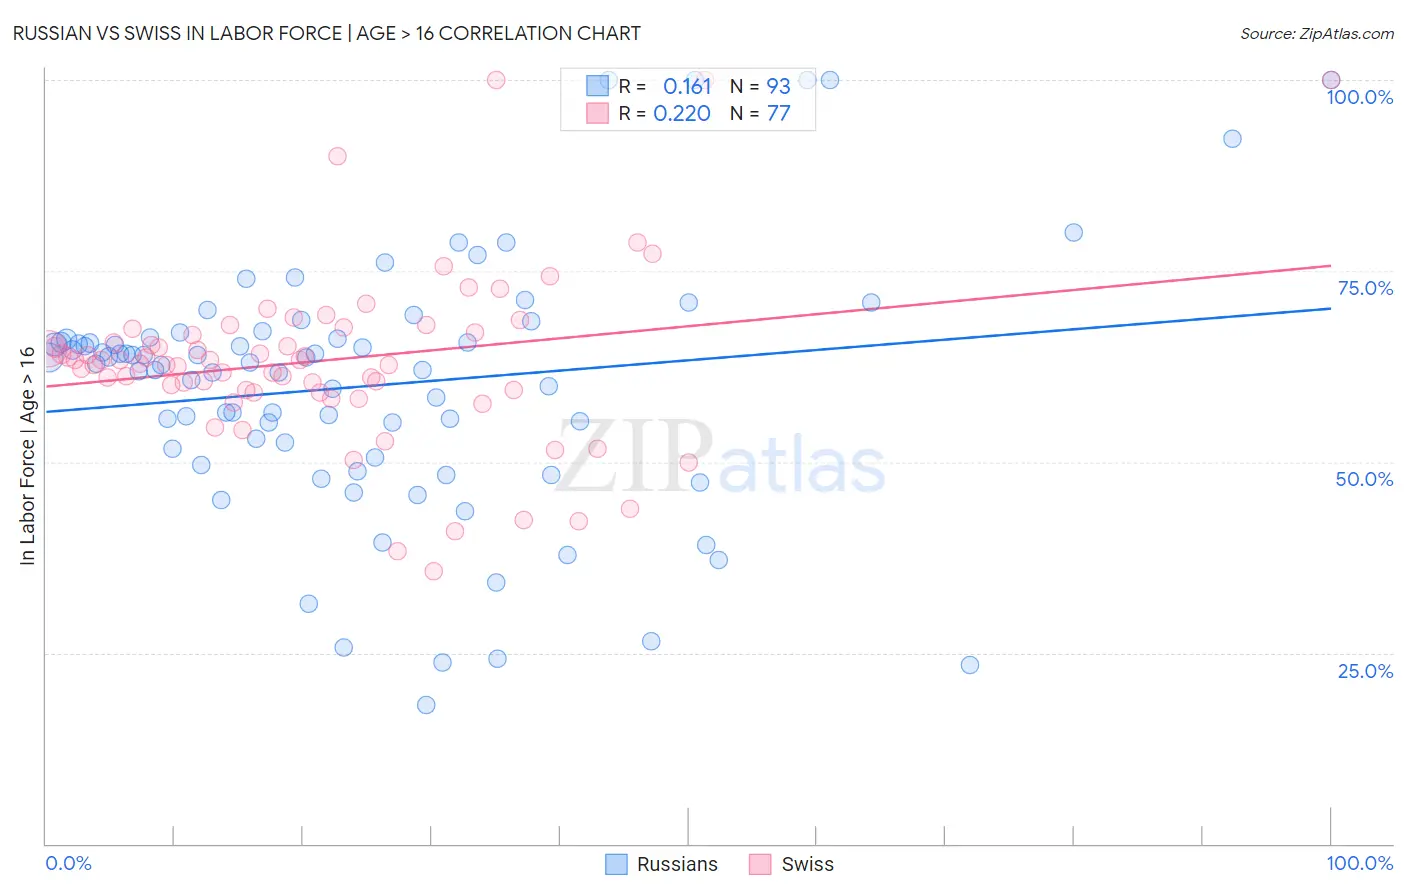
Russian vs Swiss In Labor Force | Age > 16 Correlation Chart
The statistical analysis conducted on geographies consisting of 512,265,554 people shows a poor positive correlation between the proportion of Russians and labor force participation rate among population ages 16 and over in the United States with a correlation coefficient (R) of 0.161 and weighted average of 64.9%. Similarly, the statistical analysis conducted on geographies consisting of 465,041,939 people shows a weak positive correlation between the proportion of Swiss and labor force participation rate among population ages 16 and over in the United States with a correlation coefficient (R) of 0.220 and weighted average of 64.4%, a difference of 0.67%.
In Labor Force | Age > 16 Correlation Summary
| Measurement | Russian | Swiss |
| Minimum | 18.2% | 35.7% |
| Maximum | 100.0% | 100.0% |
| Range | 81.8% | 64.3% |
| Mean | 60.0% | 63.3% |
| Median | 62.9% | 63.3% |
| Interquartile 25% (IQ1) | 51.1% | 59.3% |
| Interquartile 75% (IQ3) | 66.3% | 67.2% |
| Interquartile Range (IQR) | 15.2% | 7.9% |
| Standard Deviation (Sample) | 16.8% | 11.6% |
| Standard Deviation (Population) | 16.7% | 11.5% |
Similar Demographics by In Labor Force | Age > 16
Demographics Similar to Russians by In Labor Force | Age > 16
In terms of in labor force | age > 16, the demographic groups most similar to Russians are Slovene (64.9%, a difference of 0.0%), Jamaican (64.9%, a difference of 0.0%), Ukrainian (64.9%, a difference of 0.010%), Immigrants from Belgium (64.9%, a difference of 0.010%), and Armenian (64.9%, a difference of 0.030%).
| Demographics | Rating | Rank | In Labor Force | Age > 16 |
| Haitians | 30.6 /100 | #196 | Fair 65.0% |
| Immigrants | Italy | 28.7 /100 | #197 | Fair 65.0% |
| Greeks | 26.1 /100 | #198 | Fair 64.9% |
| Mexican American Indians | 23.1 /100 | #199 | Fair 64.9% |
| Armenians | 20.2 /100 | #200 | Fair 64.9% |
| Ukrainians | 19.6 /100 | #201 | Poor 64.9% |
| Immigrants | Belgium | 19.4 /100 | #202 | Poor 64.9% |
| Russians | 18.8 /100 | #203 | Poor 64.9% |
| Slovenes | 18.7 /100 | #204 | Poor 64.9% |
| Jamaicans | 18.7 /100 | #205 | Poor 64.9% |
| Lithuanians | 17.4 /100 | #206 | Poor 64.8% |
| Immigrants | Latin America | 16.4 /100 | #207 | Poor 64.8% |
| Belizeans | 16.2 /100 | #208 | Poor 64.8% |
| Immigrants | Trinidad and Tobago | 15.6 /100 | #209 | Poor 64.8% |
| Immigrants | Denmark | 14.7 /100 | #210 | Poor 64.8% |
Demographics Similar to Swiss by In Labor Force | Age > 16
In terms of in labor force | age > 16, the demographic groups most similar to Swiss are Immigrants from Barbados (64.4%, a difference of 0.010%), Immigrants from Caribbean (64.4%, a difference of 0.020%), German (64.4%, a difference of 0.040%), British West Indian (64.4%, a difference of 0.050%), and Portuguese (64.4%, a difference of 0.070%).
| Demographics | Rating | Rank | In Labor Force | Age > 16 |
| Immigrants | Bangladesh | 3.6 /100 | #240 | Tragic 64.5% |
| Immigrants | Dominica | 3.5 /100 | #241 | Tragic 64.5% |
| Immigrants | Netherlands | 3.4 /100 | #242 | Tragic 64.5% |
| Immigrants | Lebanon | 3.2 /100 | #243 | Tragic 64.5% |
| Tsimshian | 3.1 /100 | #244 | Tragic 64.5% |
| West Indians | 3.0 /100 | #245 | Tragic 64.5% |
| Immigrants | Caribbean | 2.3 /100 | #246 | Tragic 64.4% |
| Swiss | 2.1 /100 | #247 | Tragic 64.4% |
| Immigrants | Barbados | 2.1 /100 | #248 | Tragic 64.4% |
| Germans | 1.8 /100 | #249 | Tragic 64.4% |
| British West Indians | 1.8 /100 | #250 | Tragic 64.4% |
| Portuguese | 1.6 /100 | #251 | Tragic 64.4% |
| Immigrants | Dominican Republic | 1.5 /100 | #252 | Tragic 64.4% |
| Czechoslovakians | 1.4 /100 | #253 | Tragic 64.3% |
| Immigrants | Uzbekistan | 1.4 /100 | #254 | Tragic 64.3% |