Russian vs Immigrants from Guyana In Labor Force | Age 20-64
COMPARE
Russian
Immigrants from Guyana
In Labor Force | Age 20-64
In Labor Force | Age 20-64 Comparison
Russians
Immigrants from Guyana
80.0%
IN LABOR FORCE | AGE 20-64
95.5/ 100
METRIC RATING
103rd/ 347
METRIC RANK
78.1%
IN LABOR FORCE | AGE 20-64
0.0/ 100
METRIC RATING
284th/ 347
METRIC RANK
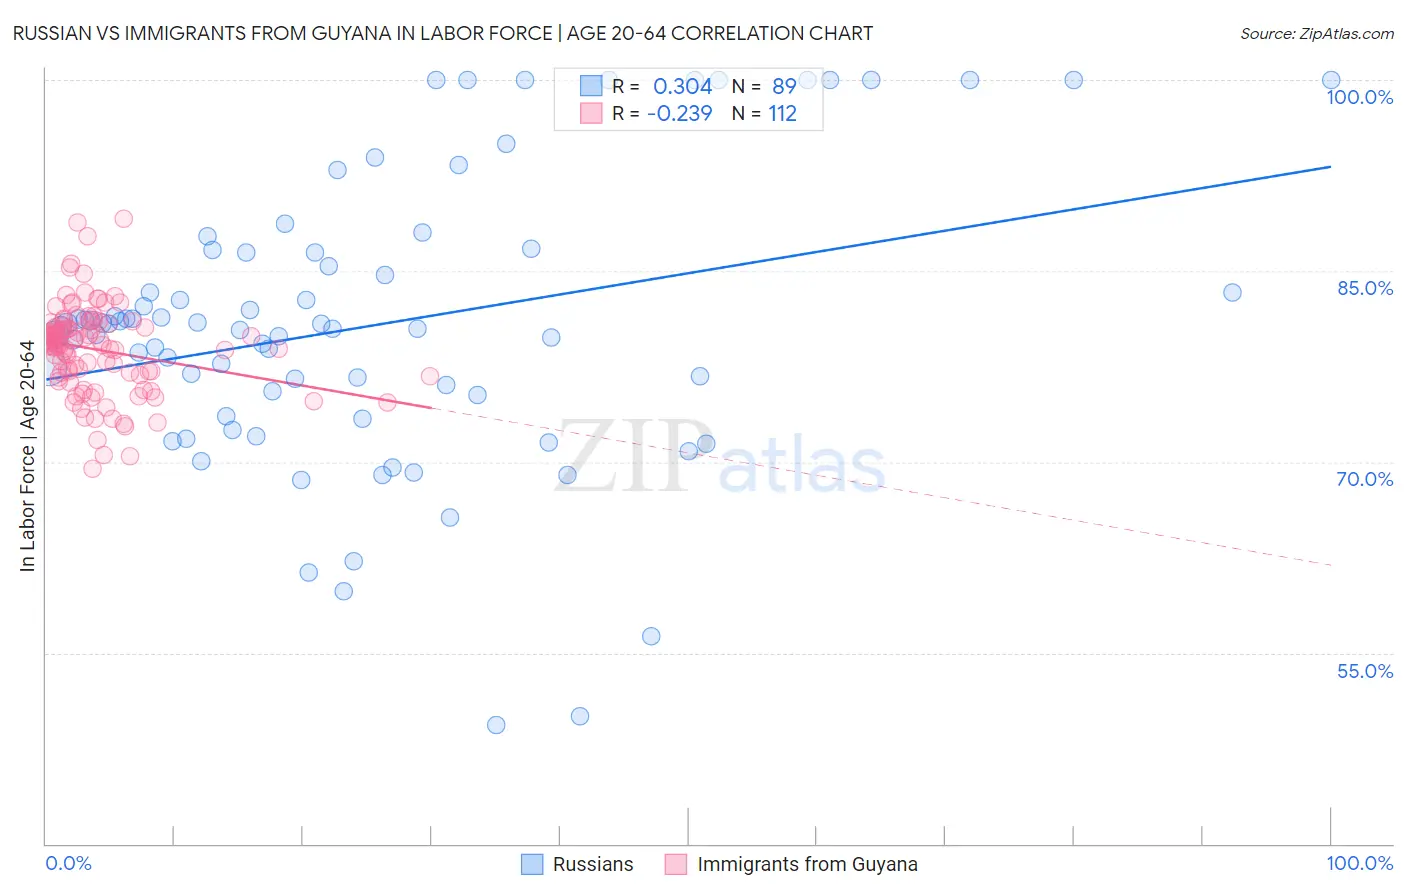
Russian vs Immigrants from Guyana In Labor Force | Age 20-64 Correlation Chart
The statistical analysis conducted on geographies consisting of 512,263,785 people shows a mild positive correlation between the proportion of Russians and labor force participation rate among population between the ages 20 and 64 in the United States with a correlation coefficient (R) of 0.304 and weighted average of 80.0%. Similarly, the statistical analysis conducted on geographies consisting of 183,664,585 people shows a weak negative correlation between the proportion of Immigrants from Guyana and labor force participation rate among population between the ages 20 and 64 in the United States with a correlation coefficient (R) of -0.239 and weighted average of 78.1%, a difference of 2.5%.
In Labor Force | Age 20-64 Correlation Summary
| Measurement | Russian | Immigrants from Guyana |
| Minimum | 49.3% | 69.5% |
| Maximum | 100.0% | 89.1% |
| Range | 50.7% | 19.6% |
| Mean | 80.7% | 78.8% |
| Median | 80.5% | 79.3% |
| Interquartile 25% (IQ1) | 74.4% | 76.7% |
| Interquartile 75% (IQ3) | 86.5% | 80.6% |
| Interquartile Range (IQR) | 12.0% | 3.9% |
| Standard Deviation (Sample) | 11.2% | 3.5% |
| Standard Deviation (Population) | 11.2% | 3.5% |
Similar Demographics by In Labor Force | Age 20-64
Demographics Similar to Russians by In Labor Force | Age 20-64
In terms of in labor force | age 20-64, the demographic groups most similar to Russians are Palestinian (80.0%, a difference of 0.0%), Immigrants from Australia (80.0%, a difference of 0.0%), Immigrants from Chile (80.1%, a difference of 0.010%), Filipino (80.1%, a difference of 0.010%), and Venezuelan (80.0%, a difference of 0.010%).
| Demographics | Rating | Rank | In Labor Force | Age 20-64 |
| Immigrants | Malaysia | 95.9 /100 | #96 | Exceptional 80.1% |
| South Americans | 95.9 /100 | #97 | Exceptional 80.1% |
| Immigrants | Uruguay | 95.8 /100 | #98 | Exceptional 80.1% |
| Immigrants | Chile | 95.7 /100 | #99 | Exceptional 80.1% |
| Filipinos | 95.6 /100 | #100 | Exceptional 80.1% |
| Palestinians | 95.5 /100 | #101 | Exceptional 80.0% |
| Immigrants | Australia | 95.5 /100 | #102 | Exceptional 80.0% |
| Russians | 95.5 /100 | #103 | Exceptional 80.0% |
| Venezuelans | 95.3 /100 | #104 | Exceptional 80.0% |
| Immigrants | Ghana | 95.0 /100 | #105 | Exceptional 80.0% |
| Greeks | 94.8 /100 | #106 | Exceptional 80.0% |
| Immigrants | Jordan | 94.8 /100 | #107 | Exceptional 80.0% |
| Iranians | 94.3 /100 | #108 | Exceptional 80.0% |
| Immigrants | Argentina | 94.1 /100 | #109 | Exceptional 80.0% |
| Estonians | 94.0 /100 | #110 | Exceptional 80.0% |
Demographics Similar to Immigrants from Guyana by In Labor Force | Age 20-64
In terms of in labor force | age 20-64, the demographic groups most similar to Immigrants from Guyana are Nonimmigrants (78.1%, a difference of 0.010%), Immigrants from St. Vincent and the Grenadines (78.1%, a difference of 0.030%), Guyanese (78.1%, a difference of 0.050%), Immigrants from Dominica (78.1%, a difference of 0.080%), and Osage (78.0%, a difference of 0.10%).
| Demographics | Rating | Rank | In Labor Force | Age 20-64 |
| Immigrants | Bahamas | 0.0 /100 | #277 | Tragic 78.2% |
| Mexican American Indians | 0.0 /100 | #278 | Tragic 78.2% |
| Belizeans | 0.0 /100 | #279 | Tragic 78.2% |
| Immigrants | Dominica | 0.0 /100 | #280 | Tragic 78.1% |
| Guyanese | 0.0 /100 | #281 | Tragic 78.1% |
| Immigrants | St. Vincent and the Grenadines | 0.0 /100 | #282 | Tragic 78.1% |
| Immigrants | Nonimmigrants | 0.0 /100 | #283 | Tragic 78.1% |
| Immigrants | Guyana | 0.0 /100 | #284 | Tragic 78.1% |
| Osage | 0.0 /100 | #285 | Tragic 78.0% |
| Immigrants | Belize | 0.0 /100 | #286 | Tragic 78.0% |
| Vietnamese | 0.0 /100 | #287 | Tragic 78.0% |
| Hmong | 0.0 /100 | #288 | Tragic 77.9% |
| Africans | 0.0 /100 | #289 | Tragic 77.9% |
| Immigrants | Bangladesh | 0.0 /100 | #290 | Tragic 77.9% |
| Spanish Americans | 0.0 /100 | #291 | Tragic 77.8% |