Russian vs Luxembourger In Labor Force | Age 20-64
COMPARE
Russian
Luxembourger
In Labor Force | Age 20-64
In Labor Force | Age 20-64 Comparison
Russians
Luxembourgers
80.0%
IN LABOR FORCE | AGE 20-64
95.5/ 100
METRIC RATING
103rd/ 347
METRIC RANK
81.9%
IN LABOR FORCE | AGE 20-64
100.0/ 100
METRIC RATING
4th/ 347
METRIC RANK
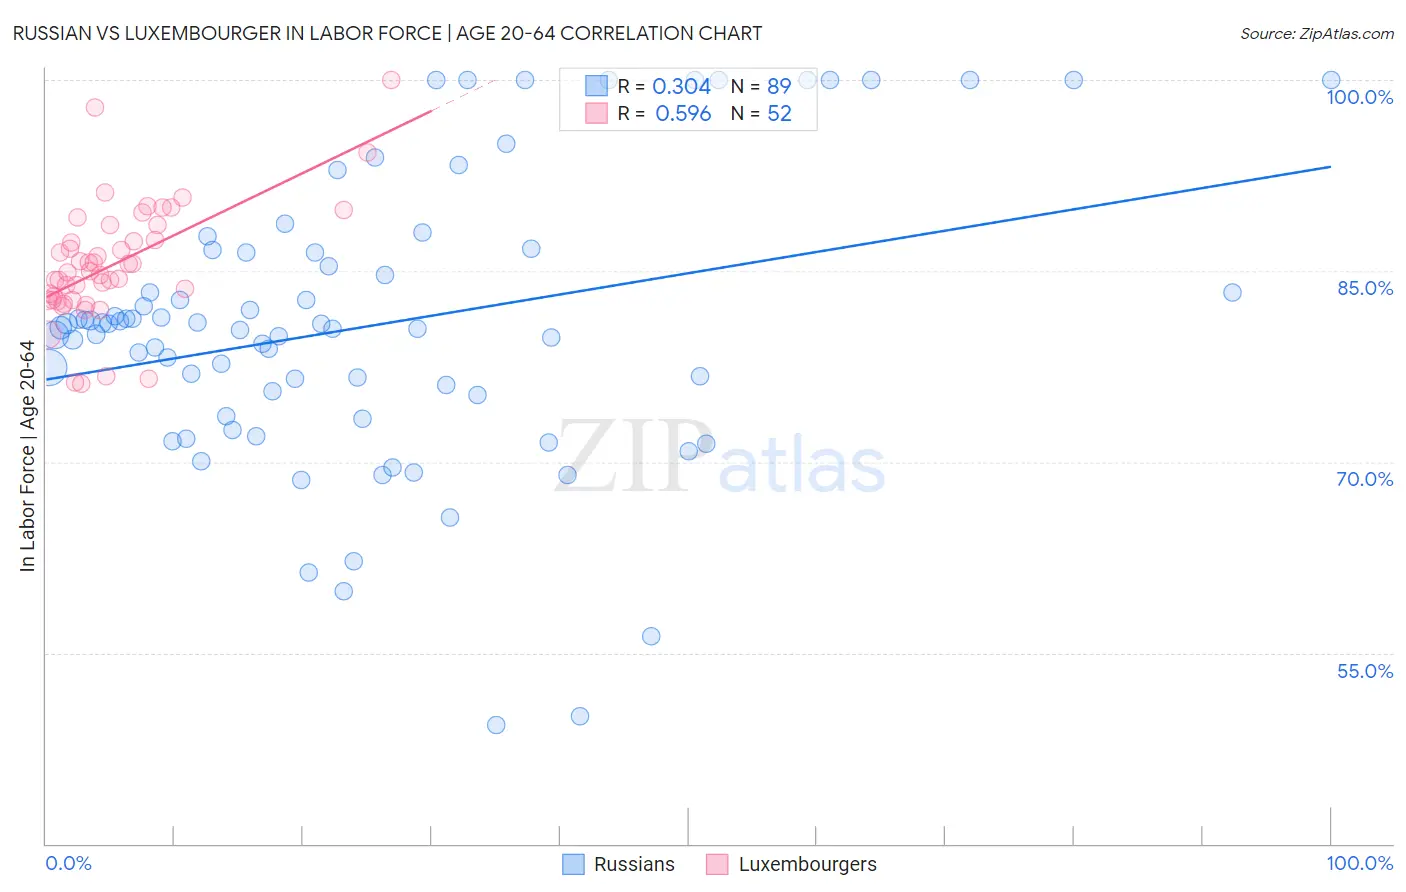
Russian vs Luxembourger In Labor Force | Age 20-64 Correlation Chart
The statistical analysis conducted on geographies consisting of 512,263,785 people shows a mild positive correlation between the proportion of Russians and labor force participation rate among population between the ages 20 and 64 in the United States with a correlation coefficient (R) of 0.304 and weighted average of 80.0%. Similarly, the statistical analysis conducted on geographies consisting of 144,682,920 people shows a substantial positive correlation between the proportion of Luxembourgers and labor force participation rate among population between the ages 20 and 64 in the United States with a correlation coefficient (R) of 0.596 and weighted average of 81.9%, a difference of 2.3%.
In Labor Force | Age 20-64 Correlation Summary
| Measurement | Russian | Luxembourger |
| Minimum | 49.3% | 76.2% |
| Maximum | 100.0% | 100.0% |
| Range | 50.7% | 23.8% |
| Mean | 80.7% | 85.5% |
| Median | 80.5% | 84.9% |
| Interquartile 25% (IQ1) | 74.4% | 82.7% |
| Interquartile 75% (IQ3) | 86.5% | 88.0% |
| Interquartile Range (IQR) | 12.0% | 5.3% |
| Standard Deviation (Sample) | 11.2% | 4.7% |
| Standard Deviation (Population) | 11.2% | 4.6% |
Similar Demographics by In Labor Force | Age 20-64
Demographics Similar to Russians by In Labor Force | Age 20-64
In terms of in labor force | age 20-64, the demographic groups most similar to Russians are Palestinian (80.0%, a difference of 0.0%), Immigrants from Australia (80.0%, a difference of 0.0%), Immigrants from Chile (80.1%, a difference of 0.010%), Filipino (80.1%, a difference of 0.010%), and Venezuelan (80.0%, a difference of 0.010%).
| Demographics | Rating | Rank | In Labor Force | Age 20-64 |
| Immigrants | Malaysia | 95.9 /100 | #96 | Exceptional 80.1% |
| South Americans | 95.9 /100 | #97 | Exceptional 80.1% |
| Immigrants | Uruguay | 95.8 /100 | #98 | Exceptional 80.1% |
| Immigrants | Chile | 95.7 /100 | #99 | Exceptional 80.1% |
| Filipinos | 95.6 /100 | #100 | Exceptional 80.1% |
| Palestinians | 95.5 /100 | #101 | Exceptional 80.0% |
| Immigrants | Australia | 95.5 /100 | #102 | Exceptional 80.0% |
| Russians | 95.5 /100 | #103 | Exceptional 80.0% |
| Venezuelans | 95.3 /100 | #104 | Exceptional 80.0% |
| Immigrants | Ghana | 95.0 /100 | #105 | Exceptional 80.0% |
| Greeks | 94.8 /100 | #106 | Exceptional 80.0% |
| Immigrants | Jordan | 94.8 /100 | #107 | Exceptional 80.0% |
| Iranians | 94.3 /100 | #108 | Exceptional 80.0% |
| Immigrants | Argentina | 94.1 /100 | #109 | Exceptional 80.0% |
| Estonians | 94.0 /100 | #110 | Exceptional 80.0% |
Demographics Similar to Luxembourgers by In Labor Force | Age 20-64
In terms of in labor force | age 20-64, the demographic groups most similar to Luxembourgers are Immigrants from Bolivia (81.9%, a difference of 0.12%), Ethiopian (82.0%, a difference of 0.13%), Bolivian (81.7%, a difference of 0.20%), Immigrants from Ethiopia (82.1%, a difference of 0.25%), and Somali (81.6%, a difference of 0.31%).
| Demographics | Rating | Rank | In Labor Force | Age 20-64 |
| Immigrants | Ethiopia | 100.0 /100 | #1 | Exceptional 82.1% |
| Ethiopians | 100.0 /100 | #2 | Exceptional 82.0% |
| Immigrants | Bolivia | 100.0 /100 | #3 | Exceptional 81.9% |
| Luxembourgers | 100.0 /100 | #4 | Exceptional 81.9% |
| Bolivians | 100.0 /100 | #5 | Exceptional 81.7% |
| Somalis | 100.0 /100 | #6 | Exceptional 81.6% |
| Immigrants | Cameroon | 100.0 /100 | #7 | Exceptional 81.6% |
| Immigrants | Somalia | 100.0 /100 | #8 | Exceptional 81.6% |
| Sierra Leoneans | 100.0 /100 | #9 | Exceptional 81.5% |
| Immigrants | Sierra Leone | 100.0 /100 | #10 | Exceptional 81.5% |
| Immigrants | Eastern Africa | 100.0 /100 | #11 | Exceptional 81.3% |
| Immigrants | Eritrea | 100.0 /100 | #12 | Exceptional 81.3% |
| Immigrants | India | 100.0 /100 | #13 | Exceptional 81.3% |
| Cambodians | 100.0 /100 | #14 | Exceptional 81.1% |
| Bulgarians | 100.0 /100 | #15 | Exceptional 81.1% |