Russian vs American Average Family Size
COMPARE
Russian
American
Average Family Size
Average Family Size Comparison
Russians
Americans
3.12
AVERAGE FAMILY SIZE
0.1/ 100
METRIC RATING
314th/ 347
METRIC RANK
3.16
AVERAGE FAMILY SIZE
1.0/ 100
METRIC RATING
264th/ 347
METRIC RANK
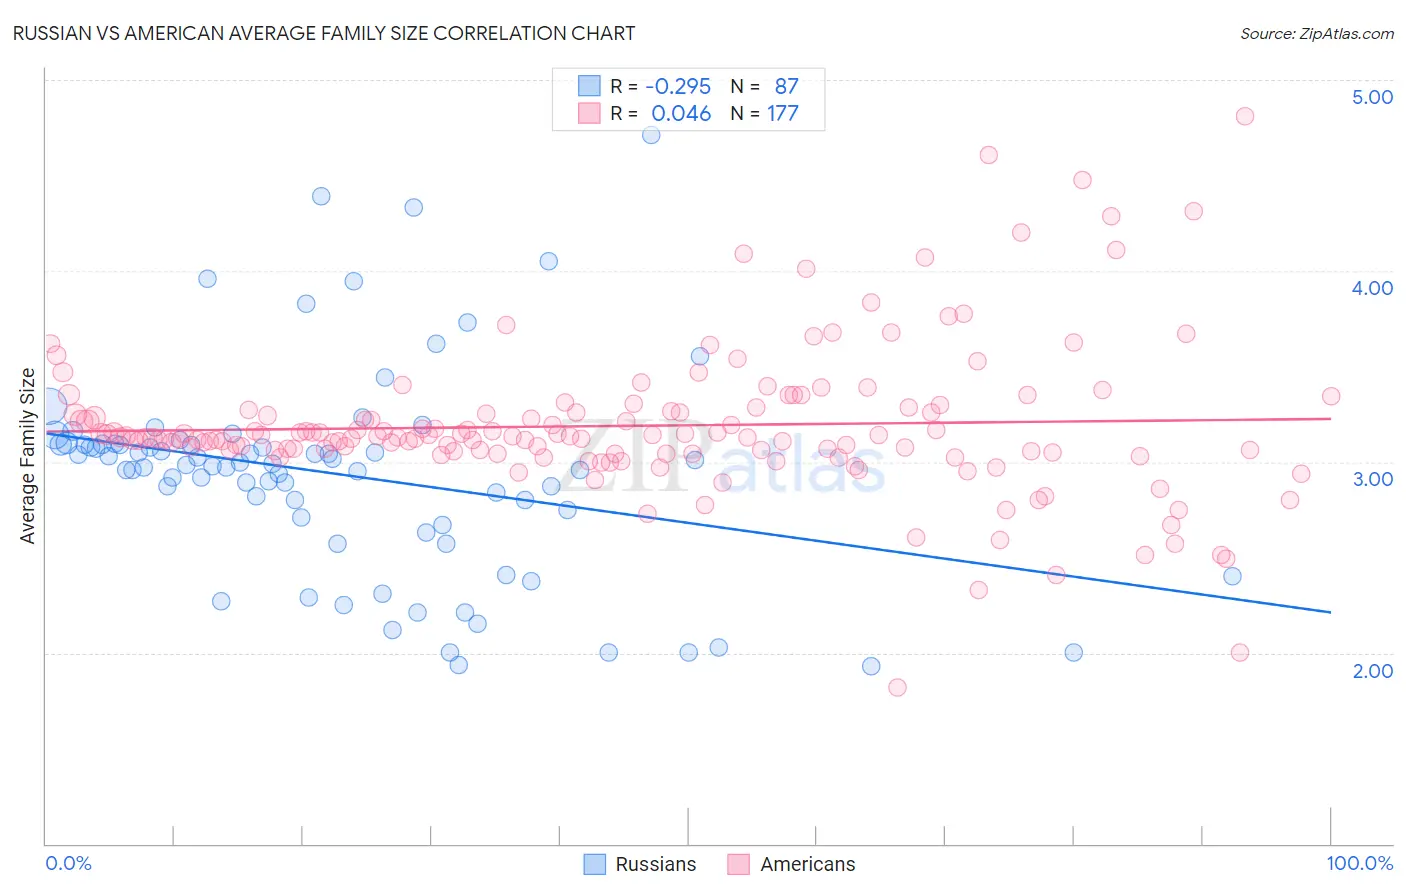
Russian vs American Average Family Size Correlation Chart
The statistical analysis conducted on geographies consisting of 511,741,869 people shows a weak negative correlation between the proportion of Russians and average family size in the United States with a correlation coefficient (R) of -0.295 and weighted average of 3.12. Similarly, the statistical analysis conducted on geographies consisting of 581,385,339 people shows no correlation between the proportion of Americans and average family size in the United States with a correlation coefficient (R) of 0.046 and weighted average of 3.16, a difference of 1.2%.
Average Family Size Correlation Summary
| Measurement | Russian | American |
| Minimum | 1.93 | 1.82 |
| Maximum | 4.71 | 4.81 |
| Range | 2.78 | 2.99 |
| Mean | 2.93 | 3.19 |
| Median | 2.98 | 3.13 |
| Interquartile 25% (IQ1) | 2.67 | 3.05 |
| Interquartile 75% (IQ3) | 3.09 | 3.27 |
| Interquartile Range (IQR) | 0.42 | 0.22 |
| Standard Deviation (Sample) | 0.55 | 0.39 |
| Standard Deviation (Population) | 0.54 | 0.39 |
Similar Demographics by Average Family Size
Demographics Similar to Russians by Average Family Size
In terms of average family size, the demographic groups most similar to Russians are Immigrants from Scotland (3.12, a difference of 0.020%), Bulgarian (3.13, a difference of 0.040%), Immigrants from Australia (3.13, a difference of 0.050%), Immigrants from Northern Europe (3.13, a difference of 0.070%), and Czechoslovakian (3.13, a difference of 0.11%).
| Demographics | Rating | Rank | Average Family Size |
| Immigrants | Serbia | 0.1 /100 | #307 | Tragic 3.13 |
| Slavs | 0.1 /100 | #308 | Tragic 3.13 |
| Northern Europeans | 0.1 /100 | #309 | Tragic 3.13 |
| Czechoslovakians | 0.1 /100 | #310 | Tragic 3.13 |
| Immigrants | Northern Europe | 0.1 /100 | #311 | Tragic 3.13 |
| Immigrants | Australia | 0.1 /100 | #312 | Tragic 3.13 |
| Bulgarians | 0.1 /100 | #313 | Tragic 3.13 |
| Russians | 0.1 /100 | #314 | Tragic 3.12 |
| Immigrants | Scotland | 0.1 /100 | #315 | Tragic 3.12 |
| Serbians | 0.1 /100 | #316 | Tragic 3.12 |
| Italians | 0.1 /100 | #317 | Tragic 3.12 |
| Eastern Europeans | 0.1 /100 | #318 | Tragic 3.12 |
| Welsh | 0.1 /100 | #319 | Tragic 3.12 |
| Immigrants | North America | 0.0 /100 | #320 | Tragic 3.12 |
| Immigrants | Austria | 0.0 /100 | #321 | Tragic 3.12 |
Demographics Similar to Americans by Average Family Size
In terms of average family size, the demographic groups most similar to Americans are Immigrants from Bulgaria (3.16, a difference of 0.020%), Immigrants from South Africa (3.16, a difference of 0.050%), Immigrants from Greece (3.16, a difference of 0.060%), Iroquois (3.16, a difference of 0.080%), and Immigrants from Russia (3.16, a difference of 0.11%).
| Demographics | Rating | Rank | Average Family Size |
| Albanians | 1.5 /100 | #257 | Tragic 3.17 |
| Turks | 1.3 /100 | #258 | Tragic 3.16 |
| Potawatomi | 1.3 /100 | #259 | Tragic 3.16 |
| Immigrants | Albania | 1.3 /100 | #260 | Tragic 3.16 |
| Immigrants | North Macedonia | 1.3 /100 | #261 | Tragic 3.16 |
| Immigrants | Russia | 1.3 /100 | #262 | Tragic 3.16 |
| Immigrants | Bulgaria | 1.0 /100 | #263 | Tragic 3.16 |
| Americans | 1.0 /100 | #264 | Tragic 3.16 |
| Immigrants | South Africa | 0.9 /100 | #265 | Tragic 3.16 |
| Immigrants | Greece | 0.9 /100 | #266 | Tragic 3.16 |
| Iroquois | 0.8 /100 | #267 | Tragic 3.16 |
| Maltese | 0.8 /100 | #268 | Tragic 3.16 |
| Immigrants | Singapore | 0.7 /100 | #269 | Tragic 3.16 |
| Tlingit-Haida | 0.7 /100 | #270 | Tragic 3.16 |
| Immigrants | Germany | 0.7 /100 | #271 | Tragic 3.15 |