Immigrants from Latvia vs Immigrants from Burma/Myanmar In Labor Force | Age > 16
COMPARE
Immigrants from Latvia
Immigrants from Burma/Myanmar
In Labor Force | Age > 16
In Labor Force | Age > 16 Comparison
Immigrants from Latvia
Immigrants from Burma/Myanmar
65.1%
IN LABOR FORCE | AGE > 16
42.9/ 100
METRIC RATING
180th/ 347
METRIC RANK
66.3%
IN LABOR FORCE | AGE > 16
99.8/ 100
METRIC RATING
61st/ 347
METRIC RANK
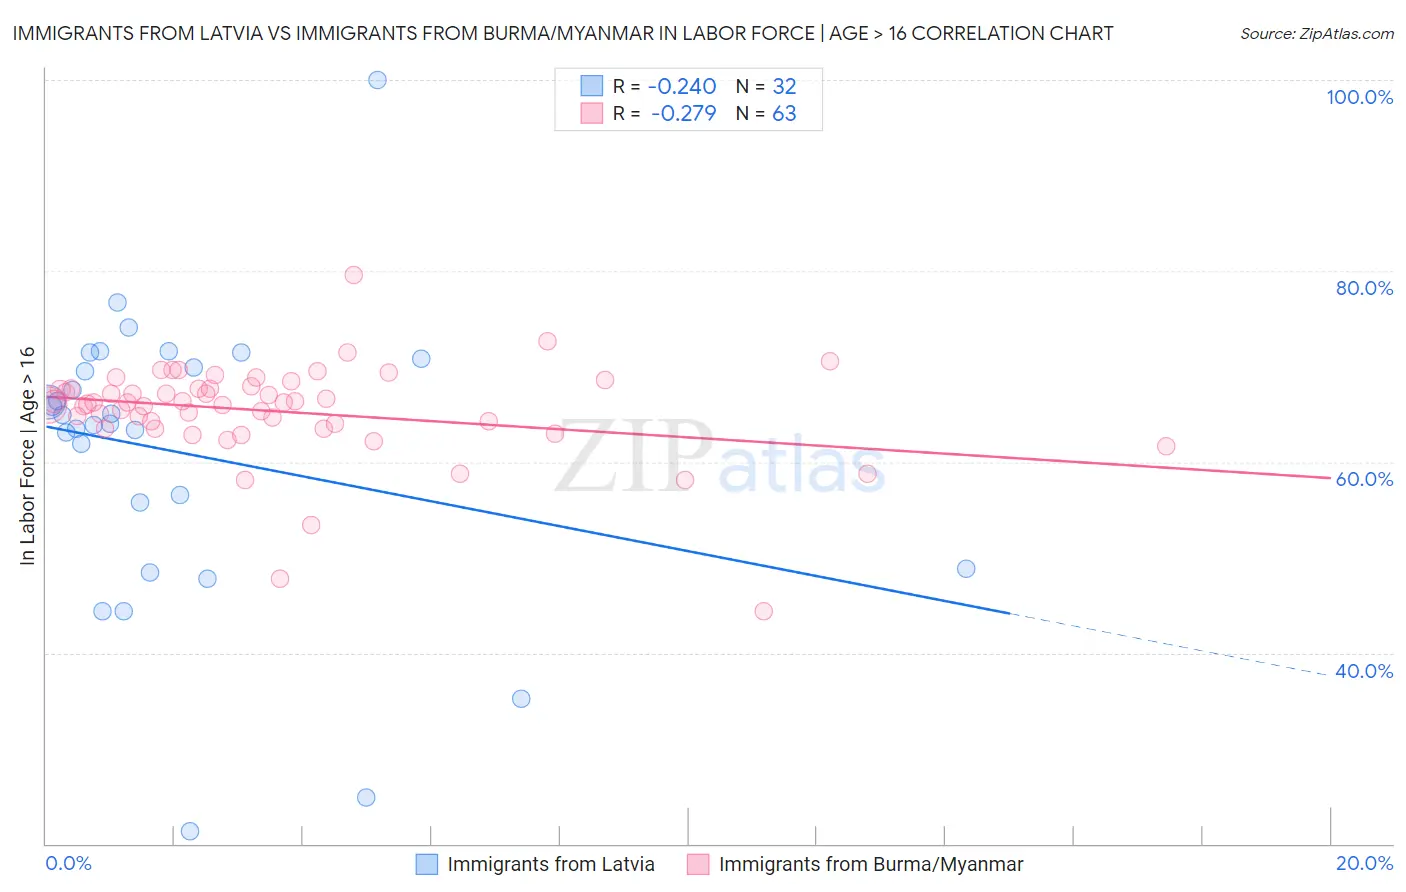
Immigrants from Latvia vs Immigrants from Burma/Myanmar In Labor Force | Age > 16 Correlation Chart
The statistical analysis conducted on geographies consisting of 113,739,608 people shows a weak negative correlation between the proportion of Immigrants from Latvia and labor force participation rate among population ages 16 and over in the United States with a correlation coefficient (R) of -0.240 and weighted average of 65.1%. Similarly, the statistical analysis conducted on geographies consisting of 172,361,065 people shows a weak negative correlation between the proportion of Immigrants from Burma/Myanmar and labor force participation rate among population ages 16 and over in the United States with a correlation coefficient (R) of -0.279 and weighted average of 66.3%, a difference of 1.9%.
In Labor Force | Age > 16 Correlation Summary
| Measurement | Immigrants from Latvia | Immigrants from Burma/Myanmar |
| Minimum | 21.3% | 44.3% |
| Maximum | 100.0% | 79.6% |
| Range | 78.7% | 35.3% |
| Mean | 60.9% | 65.3% |
| Median | 64.5% | 66.2% |
| Interquartile 25% (IQ1) | 52.3% | 63.5% |
| Interquartile 75% (IQ3) | 70.3% | 67.7% |
| Interquartile Range (IQR) | 18.1% | 4.2% |
| Standard Deviation (Sample) | 15.5% | 5.2% |
| Standard Deviation (Population) | 15.3% | 5.2% |
Similar Demographics by In Labor Force | Age > 16
Demographics Similar to Immigrants from Latvia by In Labor Force | Age > 16
In terms of in labor force | age > 16, the demographic groups most similar to Immigrants from Latvia are Immigrants from Haiti (65.1%, a difference of 0.0%), Immigrants from Panama (65.1%, a difference of 0.010%), Immigrants from Nicaragua (65.1%, a difference of 0.020%), Trinidadian and Tobagonian (65.1%, a difference of 0.030%), and Soviet Union (65.0%, a difference of 0.030%).
| Demographics | Rating | Rank | In Labor Force | Age > 16 |
| Immigrants | Ukraine | 53.7 /100 | #173 | Average 65.1% |
| Macedonians | 50.0 /100 | #174 | Average 65.1% |
| Nicaraguans | 49.7 /100 | #175 | Average 65.1% |
| Swedes | 47.4 /100 | #176 | Average 65.1% |
| Eastern Europeans | 46.2 /100 | #177 | Average 65.1% |
| Trinidadians and Tobagonians | 45.2 /100 | #178 | Average 65.1% |
| Immigrants | Haiti | 43.3 /100 | #179 | Average 65.1% |
| Immigrants | Latvia | 42.9 /100 | #180 | Average 65.1% |
| Immigrants | Panama | 42.4 /100 | #181 | Average 65.1% |
| Immigrants | Nicaragua | 41.1 /100 | #182 | Average 65.1% |
| Soviet Union | 40.5 /100 | #183 | Average 65.0% |
| Carpatho Rusyns | 40.0 /100 | #184 | Average 65.0% |
| Syrians | 40.0 /100 | #185 | Average 65.0% |
| Immigrants | Switzerland | 38.2 /100 | #186 | Fair 65.0% |
| Immigrants | Croatia | 35.7 /100 | #187 | Fair 65.0% |
Demographics Similar to Immigrants from Burma/Myanmar by In Labor Force | Age > 16
In terms of in labor force | age > 16, the demographic groups most similar to Immigrants from Burma/Myanmar are Immigrants from Peru (66.3%, a difference of 0.0%), Indonesian (66.3%, a difference of 0.0%), Immigrants from Turkey (66.3%, a difference of 0.030%), Venezuelan (66.3%, a difference of 0.040%), and Peruvian (66.3%, a difference of 0.040%).
| Demographics | Rating | Rank | In Labor Force | Age > 16 |
| Immigrants | Bosnia and Herzegovina | 99.9 /100 | #54 | Exceptional 66.5% |
| Immigrants | Venezuela | 99.9 /100 | #55 | Exceptional 66.4% |
| Immigrants | Senegal | 99.9 /100 | #56 | Exceptional 66.4% |
| Bulgarians | 99.9 /100 | #57 | Exceptional 66.4% |
| Immigrants | Saudi Arabia | 99.9 /100 | #58 | Exceptional 66.3% |
| Immigrants | Turkey | 99.9 /100 | #59 | Exceptional 66.3% |
| Immigrants | Peru | 99.8 /100 | #60 | Exceptional 66.3% |
| Immigrants | Burma/Myanmar | 99.8 /100 | #61 | Exceptional 66.3% |
| Indonesians | 99.8 /100 | #62 | Exceptional 66.3% |
| Venezuelans | 99.8 /100 | #63 | Exceptional 66.3% |
| Peruvians | 99.8 /100 | #64 | Exceptional 66.3% |
| Sri Lankans | 99.8 /100 | #65 | Exceptional 66.3% |
| Jordanians | 99.8 /100 | #66 | Exceptional 66.3% |
| Egyptians | 99.8 /100 | #67 | Exceptional 66.2% |
| Immigrants | Egypt | 99.7 /100 | #68 | Exceptional 66.2% |