Pueblo vs Immigrants from Uganda Family Households
COMPARE
Pueblo
Immigrants from Uganda
Family Households
Family Households Comparison
Pueblo
Immigrants from Uganda
68.2%
FAMILY HOUSEHOLDS
100.0/ 100
METRIC RATING
13th/ 347
METRIC RANK
62.7%
FAMILY HOUSEHOLDS
0.1/ 100
METRIC RATING
288th/ 347
METRIC RANK
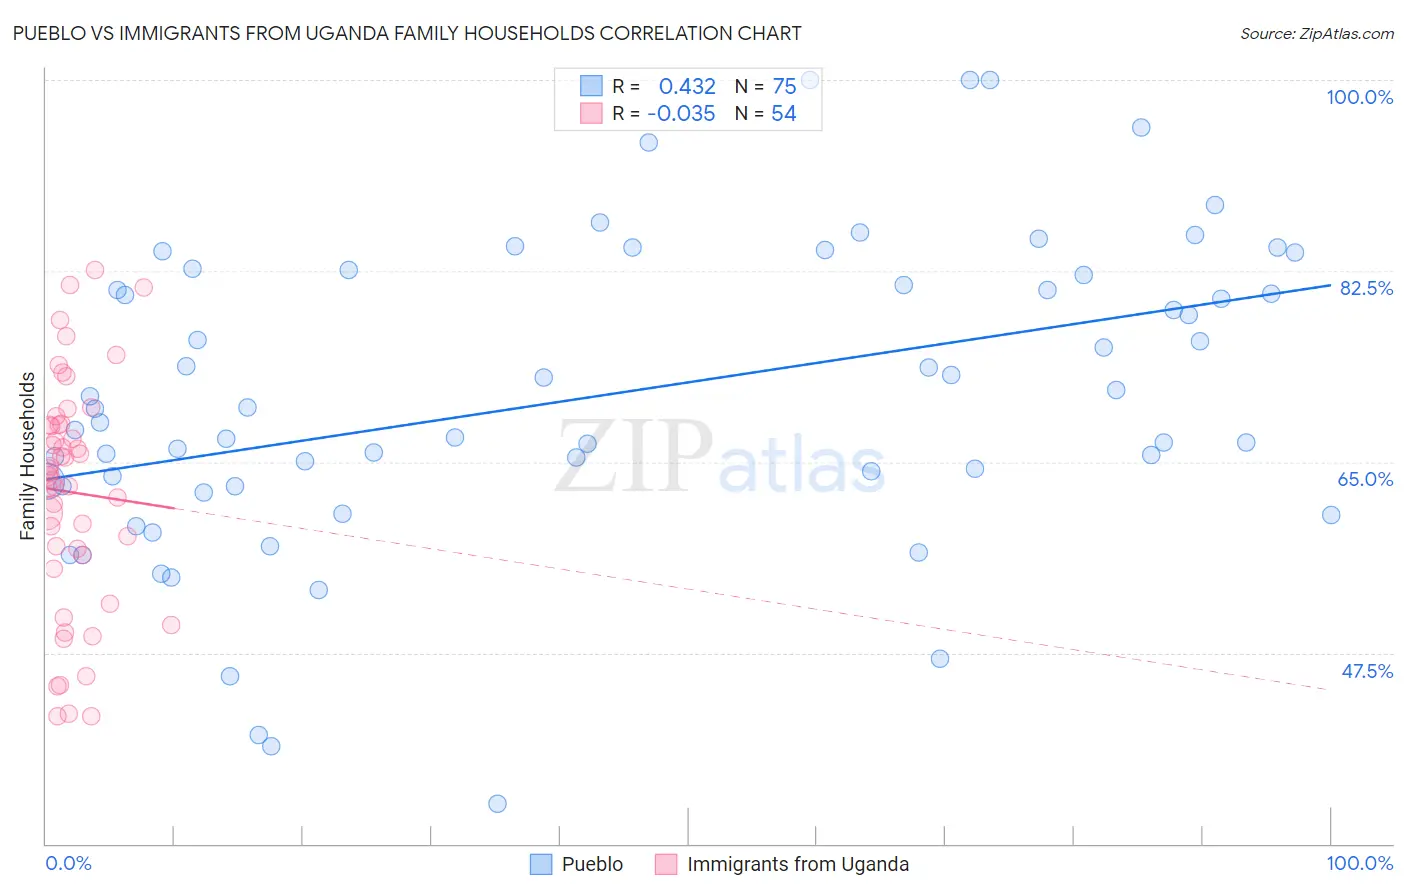
Pueblo vs Immigrants from Uganda Family Households Correlation Chart
The statistical analysis conducted on geographies consisting of 120,067,636 people shows a moderate positive correlation between the proportion of Pueblo and percentage of family households in the United States with a correlation coefficient (R) of 0.432 and weighted average of 68.2%. Similarly, the statistical analysis conducted on geographies consisting of 125,974,849 people shows no correlation between the proportion of Immigrants from Uganda and percentage of family households in the United States with a correlation coefficient (R) of -0.035 and weighted average of 62.7%, a difference of 8.7%.
Family Households Correlation Summary
| Measurement | Pueblo | Immigrants from Uganda |
| Minimum | 33.6% | 41.7% |
| Maximum | 100.0% | 82.6% |
| Range | 66.4% | 40.9% |
| Mean | 71.0% | 62.2% |
| Median | 69.9% | 63.9% |
| Interquartile 25% (IQ1) | 62.8% | 56.5% |
| Interquartile 75% (IQ3) | 82.1% | 68.3% |
| Interquartile Range (IQR) | 19.3% | 11.9% |
| Standard Deviation (Sample) | 14.1% | 10.5% |
| Standard Deviation (Population) | 14.0% | 10.4% |
Similar Demographics by Family Households
Demographics Similar to Pueblo by Family Households
In terms of family households, the demographic groups most similar to Pueblo are Immigrants from Cuba (68.2%, a difference of 0.010%), Assyrian/Chaldean/Syriac (68.2%, a difference of 0.070%), Immigrants from Vietnam (68.2%, a difference of 0.070%), Korean (68.3%, a difference of 0.080%), and Chinese (68.1%, a difference of 0.10%).
| Demographics | Rating | Rank | Family Households |
| Immigrants | Mexico | 100.0 /100 | #6 | Exceptional 69.1% |
| Mexicans | 100.0 /100 | #7 | Exceptional 69.0% |
| Immigrants | Fiji | 100.0 /100 | #8 | Exceptional 68.8% |
| Native Hawaiians | 100.0 /100 | #9 | Exceptional 68.4% |
| Immigrants | Philippines | 100.0 /100 | #10 | Exceptional 68.3% |
| Immigrants | Central America | 100.0 /100 | #11 | Exceptional 68.3% |
| Koreans | 100.0 /100 | #12 | Exceptional 68.3% |
| Pueblo | 100.0 /100 | #13 | Exceptional 68.2% |
| Immigrants | Cuba | 100.0 /100 | #14 | Exceptional 68.2% |
| Assyrians/Chaldeans/Syriacs | 100.0 /100 | #15 | Exceptional 68.2% |
| Immigrants | Vietnam | 100.0 /100 | #16 | Exceptional 68.2% |
| Chinese | 100.0 /100 | #17 | Exceptional 68.1% |
| Immigrants | Taiwan | 100.0 /100 | #18 | Exceptional 68.0% |
| Samoans | 100.0 /100 | #19 | Exceptional 67.9% |
| Inupiat | 100.0 /100 | #20 | Exceptional 67.8% |
Demographics Similar to Immigrants from Uganda by Family Households
In terms of family households, the demographic groups most similar to Immigrants from Uganda are British West Indian (62.8%, a difference of 0.020%), Latvian (62.8%, a difference of 0.020%), Mongolian (62.8%, a difference of 0.050%), Immigrants from Nepal (62.7%, a difference of 0.090%), and Australian (62.8%, a difference of 0.16%).
| Demographics | Rating | Rank | Family Households |
| Estonians | 0.2 /100 | #281 | Tragic 62.9% |
| New Zealanders | 0.1 /100 | #282 | Tragic 62.9% |
| Immigrants | Denmark | 0.1 /100 | #283 | Tragic 62.9% |
| Australians | 0.1 /100 | #284 | Tragic 62.8% |
| Mongolians | 0.1 /100 | #285 | Tragic 62.8% |
| British West Indians | 0.1 /100 | #286 | Tragic 62.8% |
| Latvians | 0.1 /100 | #287 | Tragic 62.8% |
| Immigrants | Uganda | 0.1 /100 | #288 | Tragic 62.7% |
| Immigrants | Nepal | 0.1 /100 | #289 | Tragic 62.7% |
| Immigrants | Grenada | 0.0 /100 | #290 | Tragic 62.6% |
| U.S. Virgin Islanders | 0.0 /100 | #291 | Tragic 62.6% |
| Immigrants | Burma/Myanmar | 0.0 /100 | #292 | Tragic 62.6% |
| Immigrants | Sweden | 0.0 /100 | #293 | Tragic 62.5% |
| Barbadians | 0.0 /100 | #294 | Tragic 62.5% |
| Okinawans | 0.0 /100 | #295 | Tragic 62.5% |