Potawatomi vs Puget Sound Salish College, 1 year or more
COMPARE
Potawatomi
Puget Sound Salish
College, 1 year or more
College, 1 year or more Comparison
Potawatomi
Puget Sound Salish
54.6%
COLLEGE, 1 YEAR OR MORE
0.2/ 100
METRIC RATING
266th/ 347
METRIC RANK
55.9%
COLLEGE, 1 YEAR OR MORE
1.1/ 100
METRIC RATING
239th/ 347
METRIC RANK
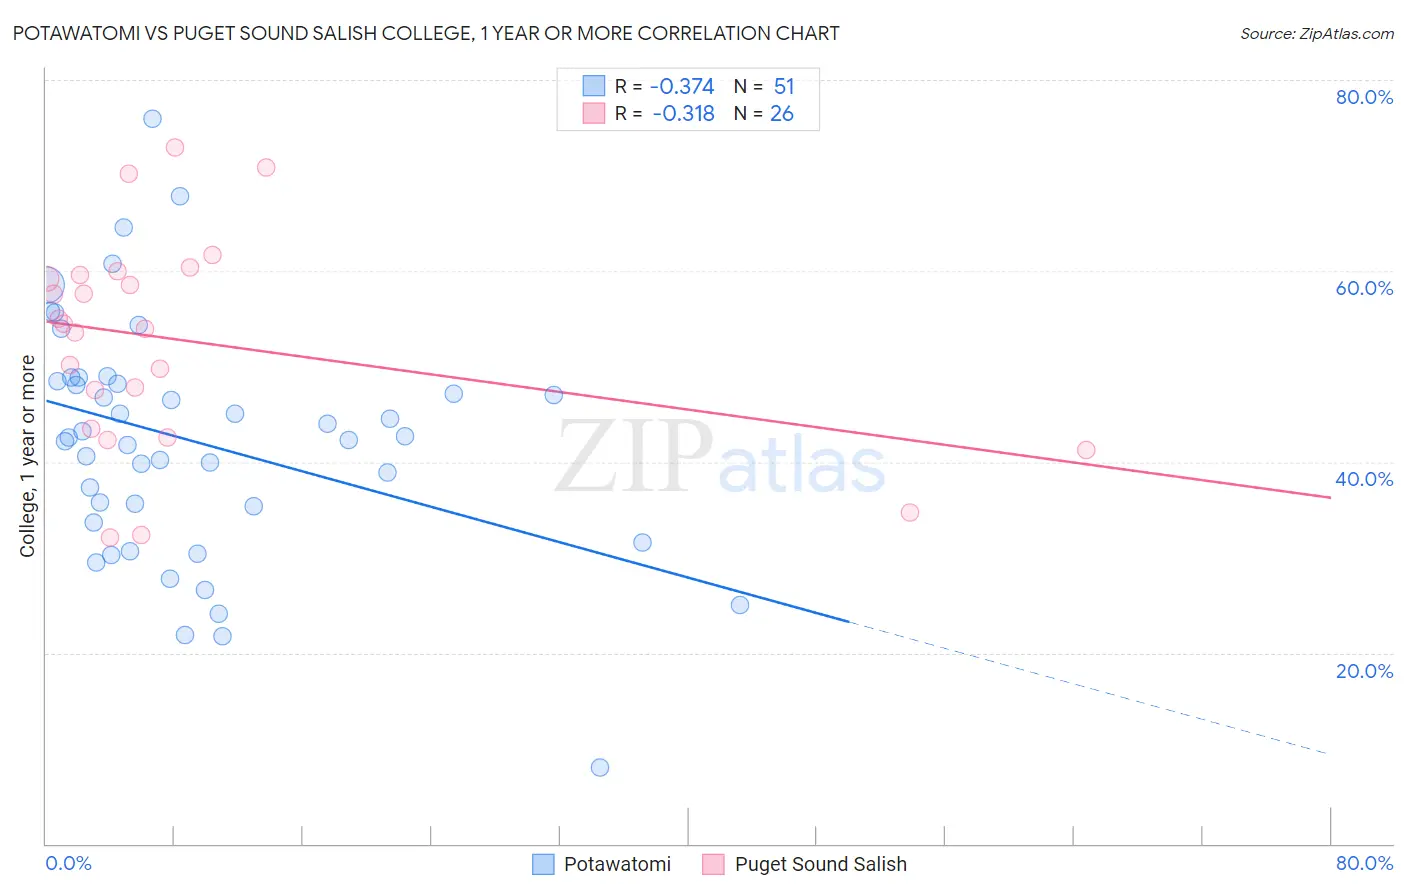
Potawatomi vs Puget Sound Salish College, 1 year or more Correlation Chart
The statistical analysis conducted on geographies consisting of 117,774,216 people shows a mild negative correlation between the proportion of Potawatomi and percentage of population with at least college, 1 year or more education in the United States with a correlation coefficient (R) of -0.374 and weighted average of 54.6%. Similarly, the statistical analysis conducted on geographies consisting of 46,155,865 people shows a mild negative correlation between the proportion of Puget Sound Salish and percentage of population with at least college, 1 year or more education in the United States with a correlation coefficient (R) of -0.318 and weighted average of 55.9%, a difference of 2.3%.
College, 1 year or more Correlation Summary
| Measurement | Potawatomi | Puget Sound Salish |
| Minimum | 8.0% | 32.1% |
| Maximum | 76.0% | 72.9% |
| Range | 68.0% | 40.8% |
| Mean | 42.0% | 52.7% |
| Median | 42.6% | 54.3% |
| Interquartile 25% (IQ1) | 33.7% | 43.4% |
| Interquartile 75% (IQ3) | 48.5% | 59.6% |
| Interquartile Range (IQR) | 14.8% | 16.2% |
| Standard Deviation (Sample) | 12.6% | 11.1% |
| Standard Deviation (Population) | 12.5% | 10.9% |
Similar Demographics by College, 1 year or more
Demographics Similar to Potawatomi by College, 1 year or more
In terms of college, 1 year or more, the demographic groups most similar to Potawatomi are Immigrants from Laos (54.7%, a difference of 0.050%), Blackfeet (54.6%, a difference of 0.070%), British West Indian (54.5%, a difference of 0.23%), Immigrants from Micronesia (54.8%, a difference of 0.25%), and Bangladeshi (54.5%, a difference of 0.26%).
| Demographics | Rating | Rank | College, 1 year or more |
| Nepalese | 0.3 /100 | #259 | Tragic 54.9% |
| Jamaicans | 0.3 /100 | #260 | Tragic 54.9% |
| Ottawa | 0.3 /100 | #261 | Tragic 54.9% |
| Immigrants | St. Vincent and the Grenadines | 0.3 /100 | #262 | Tragic 54.8% |
| U.S. Virgin Islanders | 0.3 /100 | #263 | Tragic 54.8% |
| Immigrants | Micronesia | 0.3 /100 | #264 | Tragic 54.8% |
| Immigrants | Laos | 0.2 /100 | #265 | Tragic 54.7% |
| Potawatomi | 0.2 /100 | #266 | Tragic 54.6% |
| Blackfeet | 0.2 /100 | #267 | Tragic 54.6% |
| British West Indians | 0.2 /100 | #268 | Tragic 54.5% |
| Bangladeshis | 0.2 /100 | #269 | Tragic 54.5% |
| Crow | 0.2 /100 | #270 | Tragic 54.5% |
| Bahamians | 0.2 /100 | #271 | Tragic 54.5% |
| Comanche | 0.2 /100 | #272 | Tragic 54.4% |
| Immigrants | Grenada | 0.2 /100 | #273 | Tragic 54.4% |
Demographics Similar to Puget Sound Salish by College, 1 year or more
In terms of college, 1 year or more, the demographic groups most similar to Puget Sound Salish are Trinidadian and Tobagonian (55.8%, a difference of 0.090%), French American Indian (55.8%, a difference of 0.14%), Barbadian (56.0%, a difference of 0.20%), Marshallese (55.8%, a difference of 0.25%), and Osage (55.8%, a difference of 0.26%).
| Demographics | Rating | Rank | College, 1 year or more |
| Immigrants | Bangladesh | 2.6 /100 | #232 | Tragic 56.6% |
| Immigrants | Nonimmigrants | 2.5 /100 | #233 | Tragic 56.5% |
| Spanish Americans | 1.8 /100 | #234 | Tragic 56.3% |
| West Indians | 1.8 /100 | #235 | Tragic 56.3% |
| Iroquois | 1.7 /100 | #236 | Tragic 56.2% |
| Samoans | 1.6 /100 | #237 | Tragic 56.2% |
| Barbadians | 1.3 /100 | #238 | Tragic 56.0% |
| Puget Sound Salish | 1.1 /100 | #239 | Tragic 55.9% |
| Trinidadians and Tobagonians | 1.1 /100 | #240 | Tragic 55.8% |
| French American Indians | 1.0 /100 | #241 | Tragic 55.8% |
| Marshallese | 1.0 /100 | #242 | Tragic 55.8% |
| Osage | 1.0 /100 | #243 | Tragic 55.8% |
| Chippewa | 0.9 /100 | #244 | Tragic 55.7% |
| Immigrants | Liberia | 0.8 /100 | #245 | Tragic 55.7% |
| Malaysians | 0.8 /100 | #246 | Tragic 55.6% |