Potawatomi vs Puget Sound Salish Disability Age Over 75
COMPARE
Potawatomi
Puget Sound Salish
Disability Age Over 75
Disability Age Over 75 Comparison
Potawatomi
Puget Sound Salish
49.0%
DISABILITY AGE OVER 75
0.2/ 100
METRIC RATING
270th/ 347
METRIC RANK
49.8%
DISABILITY AGE OVER 75
0.0/ 100
METRIC RATING
290th/ 347
METRIC RANK
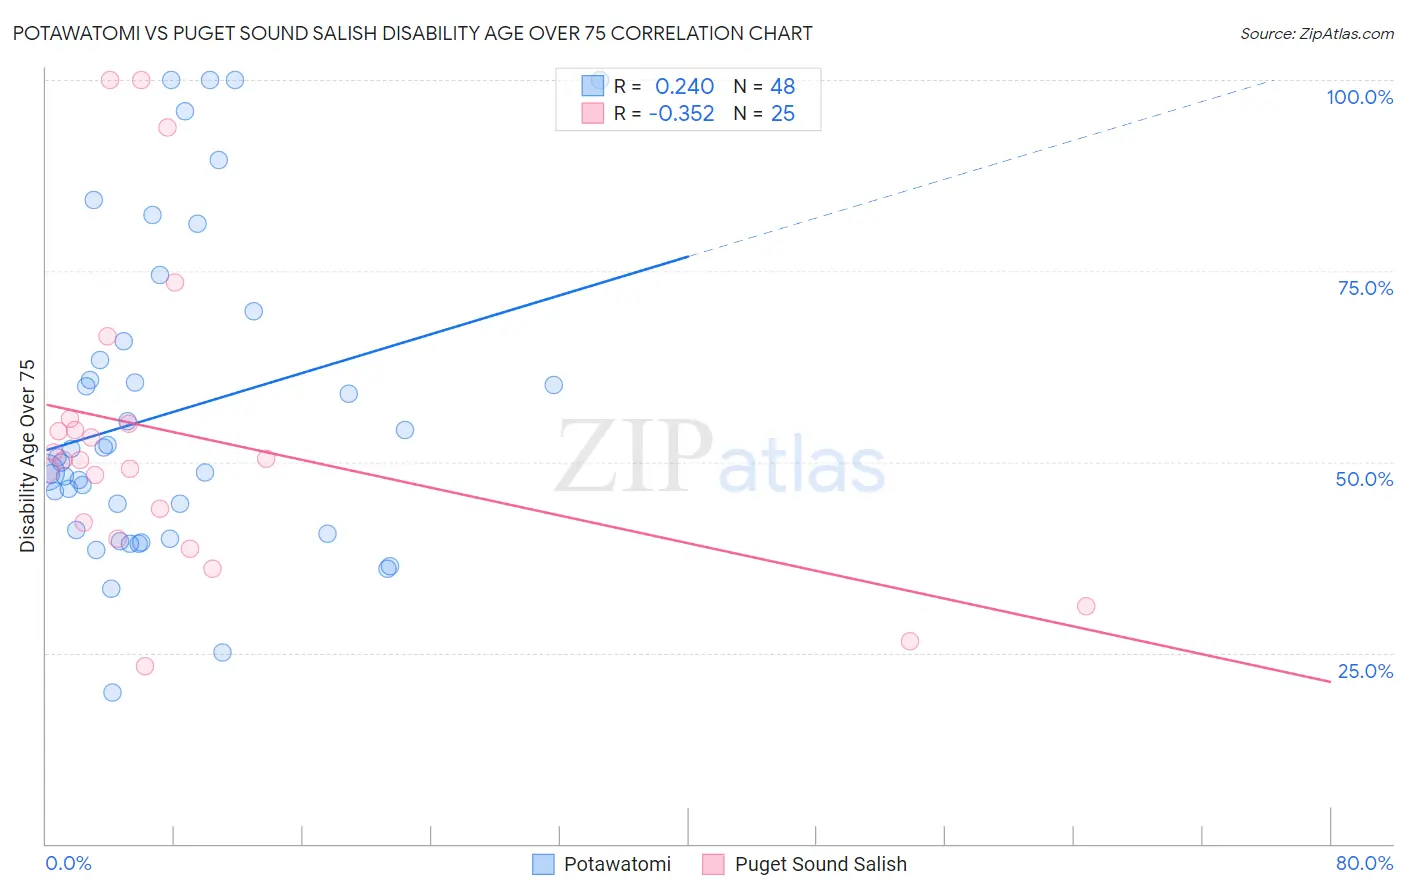
Potawatomi vs Puget Sound Salish Disability Age Over 75 Correlation Chart
The statistical analysis conducted on geographies consisting of 117,704,790 people shows a weak positive correlation between the proportion of Potawatomi and percentage of population with a disability over the age of 75 in the United States with a correlation coefficient (R) of 0.240 and weighted average of 49.0%. Similarly, the statistical analysis conducted on geographies consisting of 46,127,650 people shows a mild negative correlation between the proportion of Puget Sound Salish and percentage of population with a disability over the age of 75 in the United States with a correlation coefficient (R) of -0.352 and weighted average of 49.8%, a difference of 1.6%.
Disability Age Over 75 Correlation Summary
| Measurement | Potawatomi | Puget Sound Salish |
| Minimum | 19.8% | 23.3% |
| Maximum | 100.0% | 100.0% |
| Range | 80.2% | 76.7% |
| Mean | 56.5% | 53.4% |
| Median | 50.3% | 50.3% |
| Interquartile 25% (IQ1) | 40.8% | 41.0% |
| Interquartile 75% (IQ3) | 64.6% | 55.3% |
| Interquartile Range (IQR) | 23.8% | 14.3% |
| Standard Deviation (Sample) | 20.6% | 20.1% |
| Standard Deviation (Population) | 20.4% | 19.7% |
Demographics Similar to Potawatomi and Puget Sound Salish by Disability Age Over 75
In terms of disability age over 75, the demographic groups most similar to Potawatomi are Fijian (49.0%, a difference of 0.020%), Assyrian/Chaldean/Syriac (49.1%, a difference of 0.030%), Immigrants from Iraq (49.1%, a difference of 0.090%), Immigrants from Guatemala (49.1%, a difference of 0.16%), and Immigrants from Dominica (49.1%, a difference of 0.17%). Similarly, the demographic groups most similar to Puget Sound Salish are Osage (49.8%, a difference of 0.010%), Yaqui (49.8%, a difference of 0.090%), Sioux (49.7%, a difference of 0.14%), Immigrants from Belize (49.6%, a difference of 0.35%), and Crow (49.6%, a difference of 0.44%).
| Demographics | Rating | Rank | Disability Age Over 75 |
| Potawatomi | 0.2 /100 | #270 | Tragic 49.0% |
| Fijians | 0.2 /100 | #271 | Tragic 49.0% |
| Assyrians/Chaldeans/Syriacs | 0.2 /100 | #272 | Tragic 49.1% |
| Immigrants | Iraq | 0.1 /100 | #273 | Tragic 49.1% |
| Immigrants | Guatemala | 0.1 /100 | #274 | Tragic 49.1% |
| Immigrants | Dominica | 0.1 /100 | #275 | Tragic 49.1% |
| Immigrants | Uzbekistan | 0.1 /100 | #276 | Tragic 49.2% |
| Hawaiians | 0.1 /100 | #277 | Tragic 49.2% |
| Immigrants | Laos | 0.1 /100 | #278 | Tragic 49.2% |
| Guamanians/Chamorros | 0.0 /100 | #279 | Tragic 49.4% |
| Bangladeshis | 0.0 /100 | #280 | Tragic 49.4% |
| Belizeans | 0.0 /100 | #281 | Tragic 49.4% |
| Blacks/African Americans | 0.0 /100 | #282 | Tragic 49.5% |
| Samoans | 0.0 /100 | #283 | Tragic 49.5% |
| Immigrants | Latin America | 0.0 /100 | #284 | Tragic 49.5% |
| Crow | 0.0 /100 | #285 | Tragic 49.6% |
| Immigrants | Belize | 0.0 /100 | #286 | Tragic 49.6% |
| Sioux | 0.0 /100 | #287 | Tragic 49.7% |
| Yaqui | 0.0 /100 | #288 | Tragic 49.8% |
| Osage | 0.0 /100 | #289 | Tragic 49.8% |
| Puget Sound Salish | 0.0 /100 | #290 | Tragic 49.8% |