Potawatomi vs Immigrants from Eastern Asia In Labor Force | Age 16-19
COMPARE
Potawatomi
Immigrants from Eastern Asia
In Labor Force | Age 16-19
In Labor Force | Age 16-19 Comparison
Potawatomi
Immigrants from Eastern Asia
40.0%
IN LABOR FORCE | AGE 16-19
99.9/ 100
METRIC RATING
69th/ 347
METRIC RANK
32.0%
IN LABOR FORCE | AGE 16-19
0.0/ 100
METRIC RATING
309th/ 347
METRIC RANK
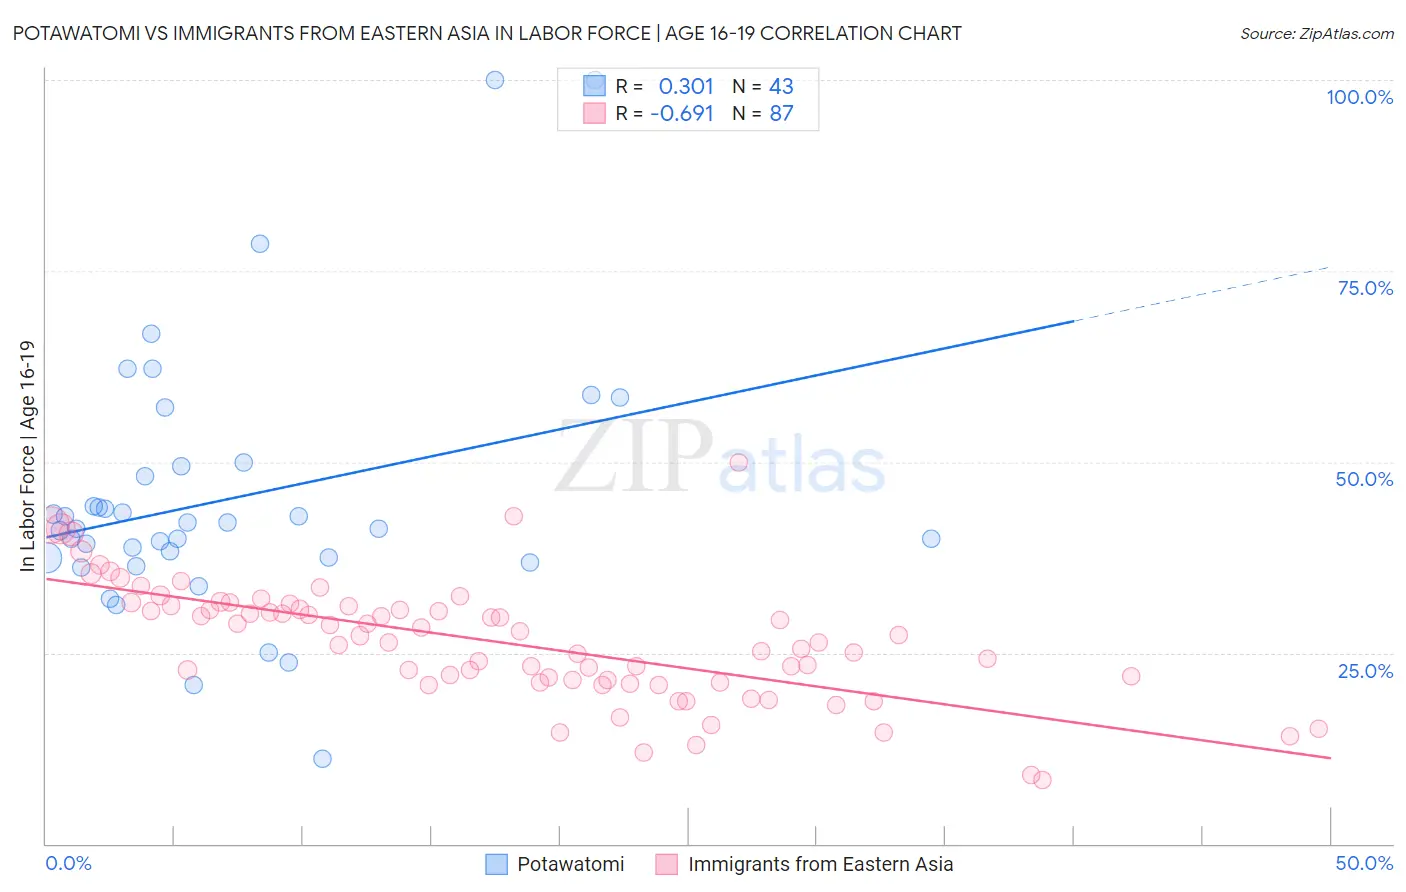
Potawatomi vs Immigrants from Eastern Asia In Labor Force | Age 16-19 Correlation Chart
The statistical analysis conducted on geographies consisting of 117,698,068 people shows a mild positive correlation between the proportion of Potawatomi and labor force participation rate among population between the ages 16 and 19 in the United States with a correlation coefficient (R) of 0.301 and weighted average of 40.0%. Similarly, the statistical analysis conducted on geographies consisting of 498,676,879 people shows a significant negative correlation between the proportion of Immigrants from Eastern Asia and labor force participation rate among population between the ages 16 and 19 in the United States with a correlation coefficient (R) of -0.691 and weighted average of 32.0%, a difference of 25.0%.
In Labor Force | Age 16-19 Correlation Summary
| Measurement | Potawatomi | Immigrants from Eastern Asia |
| Minimum | 11.1% | 8.3% |
| Maximum | 100.0% | 50.0% |
| Range | 88.9% | 41.7% |
| Mean | 45.1% | 26.4% |
| Median | 41.3% | 26.4% |
| Interquartile 25% (IQ1) | 37.4% | 21.2% |
| Interquartile 75% (IQ3) | 49.5% | 31.2% |
| Interquartile Range (IQR) | 12.1% | 10.0% |
| Standard Deviation (Sample) | 17.3% | 7.7% |
| Standard Deviation (Population) | 17.1% | 7.7% |
Similar Demographics by In Labor Force | Age 16-19
Demographics Similar to Potawatomi by In Labor Force | Age 16-19
In terms of in labor force | age 16-19, the demographic groups most similar to Potawatomi are Portuguese (40.0%, a difference of 0.050%), Italian (40.1%, a difference of 0.070%), Canadian (40.1%, a difference of 0.13%), Nonimmigrants (40.1%, a difference of 0.14%), and Serbian (39.9%, a difference of 0.22%).
| Demographics | Rating | Rank | In Labor Force | Age 16-19 |
| Cherokee | 100.0 /100 | #62 | Exceptional 40.2% |
| Northern Europeans | 100.0 /100 | #63 | Exceptional 40.2% |
| Immigrants | Micronesia | 100.0 /100 | #64 | Exceptional 40.2% |
| Kenyans | 100.0 /100 | #65 | Exceptional 40.1% |
| Immigrants | Nonimmigrants | 100.0 /100 | #66 | Exceptional 40.1% |
| Canadians | 100.0 /100 | #67 | Exceptional 40.1% |
| Italians | 99.9 /100 | #68 | Exceptional 40.1% |
| Potawatomi | 99.9 /100 | #69 | Exceptional 40.0% |
| Portuguese | 99.9 /100 | #70 | Exceptional 40.0% |
| Serbians | 99.9 /100 | #71 | Exceptional 39.9% |
| Iroquois | 99.9 /100 | #72 | Exceptional 39.9% |
| Immigrants | Middle Africa | 99.9 /100 | #73 | Exceptional 39.9% |
| Hungarians | 99.9 /100 | #74 | Exceptional 39.8% |
| French American Indians | 99.9 /100 | #75 | Exceptional 39.8% |
| Malaysians | 99.9 /100 | #76 | Exceptional 39.7% |
Demographics Similar to Immigrants from Eastern Asia by In Labor Force | Age 16-19
In terms of in labor force | age 16-19, the demographic groups most similar to Immigrants from Eastern Asia are Immigrants from Iran (32.0%, a difference of 0.14%), Navajo (32.1%, a difference of 0.18%), Indian (Asian) (31.9%, a difference of 0.50%), Immigrants from Jamaica (32.2%, a difference of 0.53%), and Immigrants from Belize (31.8%, a difference of 0.65%).
| Demographics | Rating | Rank | In Labor Force | Age 16-19 |
| Belizeans | 0.0 /100 | #302 | Tragic 32.8% |
| Immigrants | Dominica | 0.0 /100 | #303 | Tragic 32.5% |
| Israelis | 0.0 /100 | #304 | Tragic 32.4% |
| Nicaraguans | 0.0 /100 | #305 | Tragic 32.4% |
| Spanish American Indians | 0.0 /100 | #306 | Tragic 32.4% |
| Immigrants | Jamaica | 0.0 /100 | #307 | Tragic 32.2% |
| Navajo | 0.0 /100 | #308 | Tragic 32.1% |
| Immigrants | Eastern Asia | 0.0 /100 | #309 | Tragic 32.0% |
| Immigrants | Iran | 0.0 /100 | #310 | Tragic 32.0% |
| Indians (Asian) | 0.0 /100 | #311 | Tragic 31.9% |
| Immigrants | Belize | 0.0 /100 | #312 | Tragic 31.8% |
| Hopi | 0.0 /100 | #313 | Tragic 31.8% |
| Cubans | 0.0 /100 | #314 | Tragic 31.8% |
| Immigrants | West Indies | 0.0 /100 | #315 | Tragic 31.7% |
| Filipinos | 0.0 /100 | #316 | Tragic 31.7% |