Immigrants from Norway vs Immigrants from Greece In Labor Force | Age > 16
COMPARE
Immigrants from Norway
Immigrants from Greece
In Labor Force | Age > 16
In Labor Force | Age > 16 Comparison
Immigrants from Norway
Immigrants from Greece
64.6%
IN LABOR FORCE | AGE > 16
4.6/ 100
METRIC RATING
236th/ 347
METRIC RANK
65.0%
IN LABOR FORCE | AGE > 16
34.3/ 100
METRIC RATING
189th/ 347
METRIC RANK
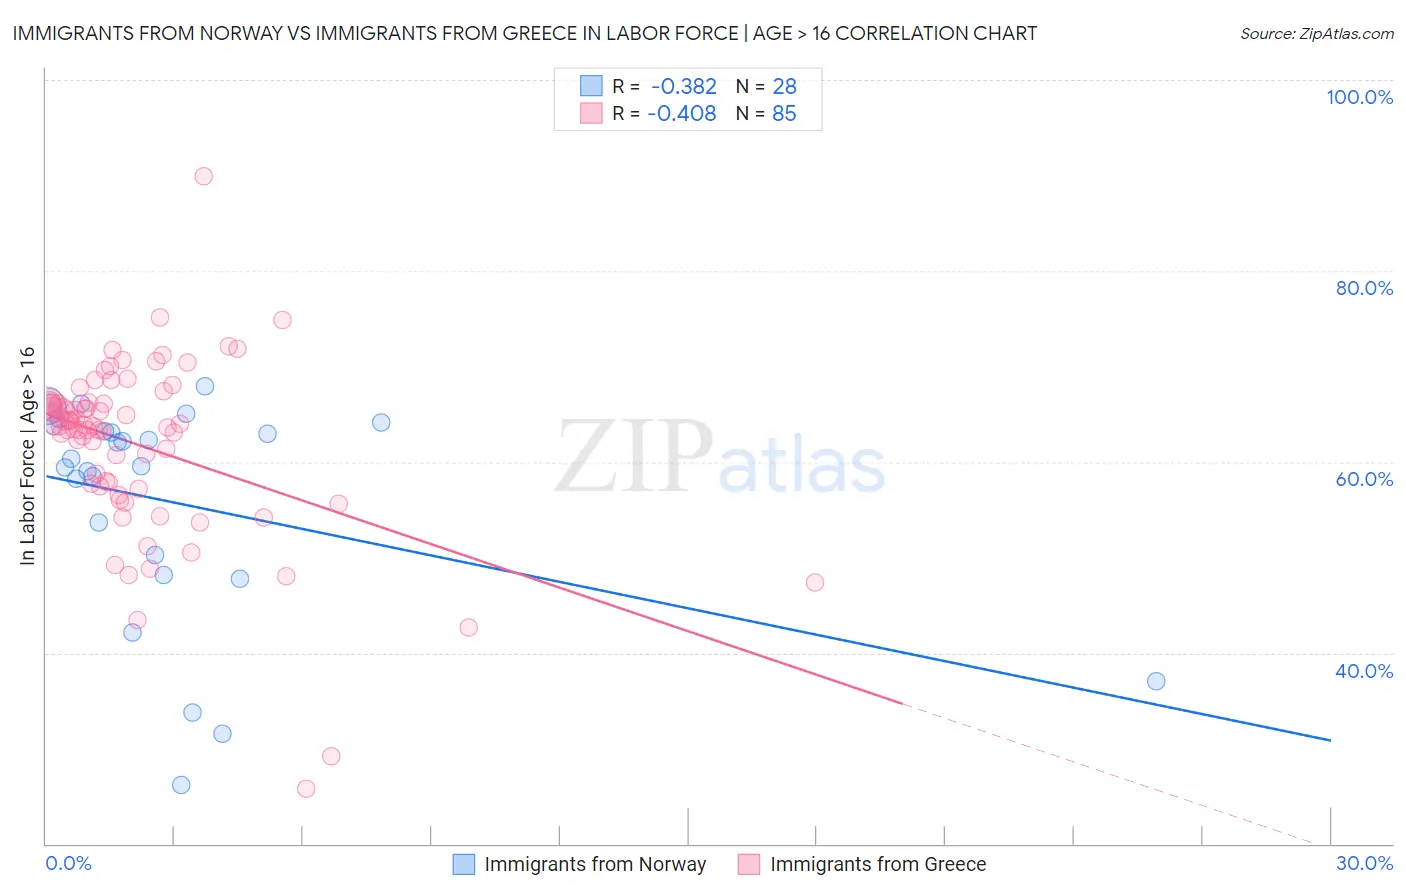
Immigrants from Norway vs Immigrants from Greece In Labor Force | Age > 16 Correlation Chart
The statistical analysis conducted on geographies consisting of 116,717,057 people shows a mild negative correlation between the proportion of Immigrants from Norway and labor force participation rate among population ages 16 and over in the United States with a correlation coefficient (R) of -0.382 and weighted average of 64.6%. Similarly, the statistical analysis conducted on geographies consisting of 216,877,956 people shows a moderate negative correlation between the proportion of Immigrants from Greece and labor force participation rate among population ages 16 and over in the United States with a correlation coefficient (R) of -0.408 and weighted average of 65.0%, a difference of 0.67%.
In Labor Force | Age > 16 Correlation Summary
| Measurement | Immigrants from Norway | Immigrants from Greece |
| Minimum | 26.2% | 25.8% |
| Maximum | 67.9% | 89.9% |
| Range | 41.7% | 64.1% |
| Mean | 55.7% | 61.8% |
| Median | 59.9% | 63.8% |
| Interquartile 25% (IQ1) | 49.1% | 57.6% |
| Interquartile 75% (IQ3) | 63.5% | 66.2% |
| Interquartile Range (IQR) | 14.4% | 8.6% |
| Standard Deviation (Sample) | 11.6% | 9.2% |
| Standard Deviation (Population) | 11.4% | 9.2% |
Similar Demographics by In Labor Force | Age > 16
Demographics Similar to Immigrants from Norway by In Labor Force | Age > 16
In terms of in labor force | age > 16, the demographic groups most similar to Immigrants from Norway are Vietnamese (64.6%, a difference of 0.0%), Austrian (64.6%, a difference of 0.0%), Italian (64.6%, a difference of 0.0%), Slavic (64.6%, a difference of 0.020%), and Lebanese (64.5%, a difference of 0.050%).
| Demographics | Rating | Rank | In Labor Force | Age > 16 |
| British | 7.3 /100 | #229 | Tragic 64.7% |
| Chinese | 7.3 /100 | #230 | Tragic 64.7% |
| Immigrants | Northern Europe | 7.2 /100 | #231 | Tragic 64.7% |
| Africans | 5.8 /100 | #232 | Tragic 64.6% |
| Slavs | 4.9 /100 | #233 | Tragic 64.6% |
| Vietnamese | 4.7 /100 | #234 | Tragic 64.6% |
| Austrians | 4.6 /100 | #235 | Tragic 64.6% |
| Immigrants | Norway | 4.6 /100 | #236 | Tragic 64.6% |
| Italians | 4.6 /100 | #237 | Tragic 64.6% |
| Lebanese | 3.9 /100 | #238 | Tragic 64.5% |
| Immigrants | Hungary | 3.8 /100 | #239 | Tragic 64.5% |
| Immigrants | Bangladesh | 3.6 /100 | #240 | Tragic 64.5% |
| Immigrants | Dominica | 3.5 /100 | #241 | Tragic 64.5% |
| Immigrants | Netherlands | 3.4 /100 | #242 | Tragic 64.5% |
| Immigrants | Lebanon | 3.2 /100 | #243 | Tragic 64.5% |
Demographics Similar to Immigrants from Greece by In Labor Force | Age > 16
In terms of in labor force | age > 16, the demographic groups most similar to Immigrants from Greece are Barbadian (65.0%, a difference of 0.0%), Immigrants from Portugal (65.0%, a difference of 0.010%), Scandinavian (65.0%, a difference of 0.010%), Immigrants from Fiji (65.0%, a difference of 0.010%), and Immigrants from Europe (65.0%, a difference of 0.010%).
| Demographics | Rating | Rank | In Labor Force | Age > 16 |
| Immigrants | Nicaragua | 41.1 /100 | #182 | Average 65.1% |
| Soviet Union | 40.5 /100 | #183 | Average 65.0% |
| Carpatho Rusyns | 40.0 /100 | #184 | Average 65.0% |
| Syrians | 40.0 /100 | #185 | Average 65.0% |
| Immigrants | Switzerland | 38.2 /100 | #186 | Fair 65.0% |
| Immigrants | Croatia | 35.7 /100 | #187 | Fair 65.0% |
| Immigrants | Portugal | 34.8 /100 | #188 | Fair 65.0% |
| Immigrants | Greece | 34.3 /100 | #189 | Fair 65.0% |
| Barbadians | 33.9 /100 | #190 | Fair 65.0% |
| Scandinavians | 33.7 /100 | #191 | Fair 65.0% |
| Immigrants | Fiji | 33.7 /100 | #192 | Fair 65.0% |
| Immigrants | Europe | 33.6 /100 | #193 | Fair 65.0% |
| Immigrants | Southern Europe | 31.3 /100 | #194 | Fair 65.0% |
| Romanians | 31.1 /100 | #195 | Fair 65.0% |
| Haitians | 30.6 /100 | #196 | Fair 65.0% |