Pima vs Bangladeshi In Labor Force | Age 30-34
COMPARE
Pima
Bangladeshi
In Labor Force | Age 30-34
In Labor Force | Age 30-34 Comparison
Pima
Bangladeshis
79.0%
IN LABOR FORCE | AGE 30-34
0.0/ 100
METRIC RATING
338th/ 347
METRIC RANK
84.3%
IN LABOR FORCE | AGE 30-34
9.4/ 100
METRIC RATING
207th/ 347
METRIC RANK
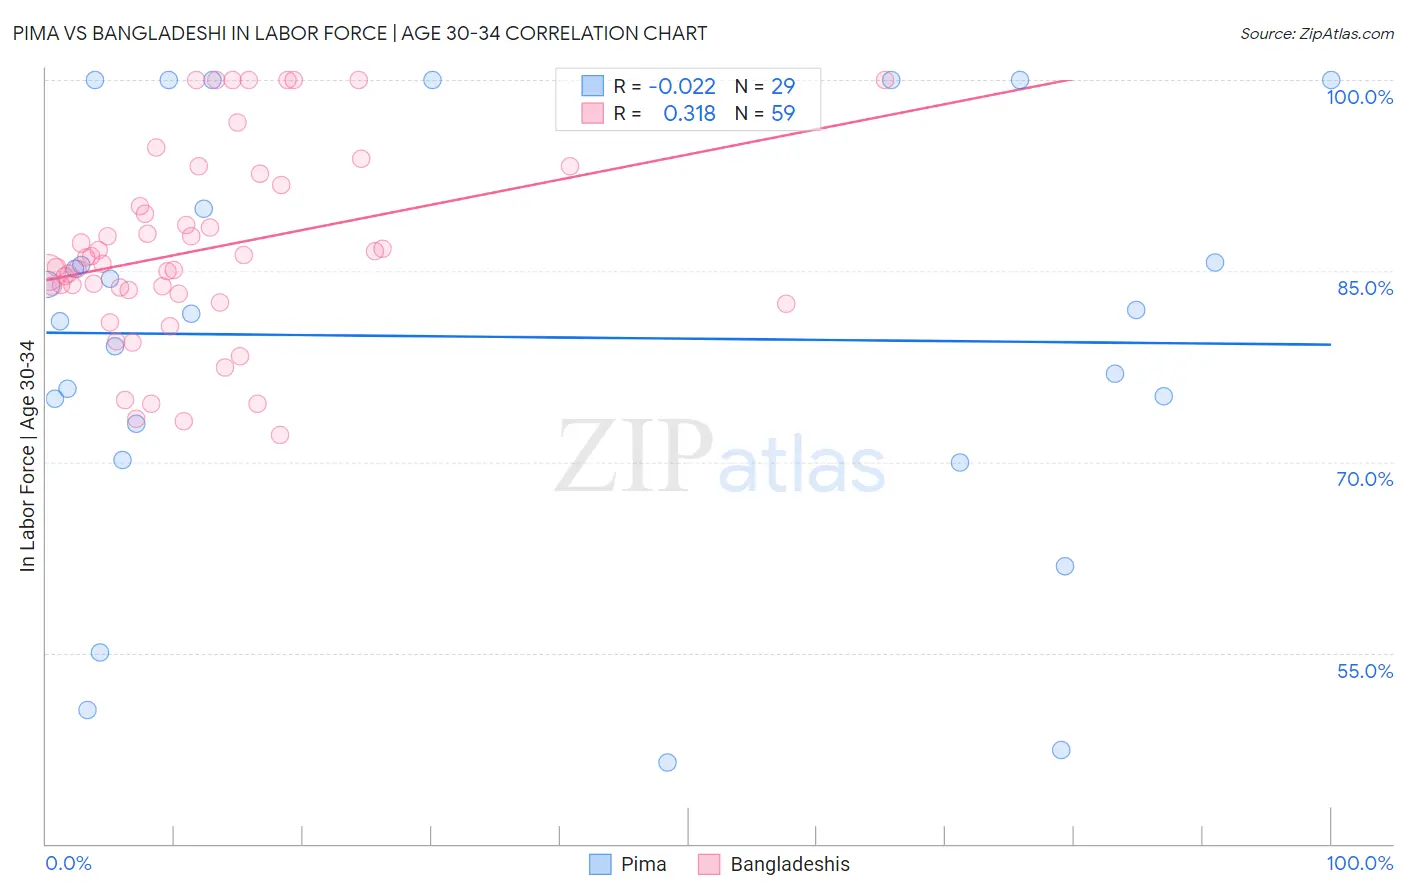
Pima vs Bangladeshi In Labor Force | Age 30-34 Correlation Chart
The statistical analysis conducted on geographies consisting of 61,528,436 people shows no correlation between the proportion of Pima and labor force participation rate among population between the ages 30 and 34 in the United States with a correlation coefficient (R) of -0.022 and weighted average of 79.0%. Similarly, the statistical analysis conducted on geographies consisting of 141,415,377 people shows a mild positive correlation between the proportion of Bangladeshis and labor force participation rate among population between the ages 30 and 34 in the United States with a correlation coefficient (R) of 0.318 and weighted average of 84.3%, a difference of 6.7%.
In Labor Force | Age 30-34 Correlation Summary
| Measurement | Pima | Bangladeshi |
| Minimum | 46.4% | 72.1% |
| Maximum | 100.0% | 100.0% |
| Range | 53.6% | 27.9% |
| Mean | 79.8% | 86.7% |
| Median | 81.6% | 85.5% |
| Interquartile 25% (IQ1) | 71.6% | 83.2% |
| Interquartile 75% (IQ3) | 95.0% | 91.8% |
| Interquartile Range (IQR) | 23.4% | 8.6% |
| Standard Deviation (Sample) | 16.2% | 7.5% |
| Standard Deviation (Population) | 15.9% | 7.4% |
Similar Demographics by In Labor Force | Age 30-34
Demographics Similar to Pima by In Labor Force | Age 30-34
In terms of in labor force | age 30-34, the demographic groups most similar to Pima are Apache (79.0%, a difference of 0.030%), Yakama (79.1%, a difference of 0.12%), Ute (78.9%, a difference of 0.13%), Native/Alaskan (79.2%, a difference of 0.16%), and Marshallese (79.2%, a difference of 0.24%).
| Demographics | Rating | Rank | In Labor Force | Age 30-34 |
| Houma | 0.0 /100 | #331 | Tragic 79.9% |
| Kiowa | 0.0 /100 | #332 | Tragic 79.8% |
| Inupiat | 0.0 /100 | #333 | Tragic 79.7% |
| Hopi | 0.0 /100 | #334 | Tragic 79.3% |
| Marshallese | 0.0 /100 | #335 | Tragic 79.2% |
| Natives/Alaskans | 0.0 /100 | #336 | Tragic 79.2% |
| Yakama | 0.0 /100 | #337 | Tragic 79.1% |
| Pima | 0.0 /100 | #338 | Tragic 79.0% |
| Apache | 0.0 /100 | #339 | Tragic 79.0% |
| Ute | 0.0 /100 | #340 | Tragic 78.9% |
| Immigrants | Yemen | 0.0 /100 | #341 | Tragic 78.2% |
| Tohono O'odham | 0.0 /100 | #342 | Tragic 77.7% |
| Lumbee | 0.0 /100 | #343 | Tragic 77.3% |
| Yuman | 0.0 /100 | #344 | Tragic 77.1% |
| Yup'ik | 0.0 /100 | #345 | Tragic 76.4% |
Demographics Similar to Bangladeshis by In Labor Force | Age 30-34
In terms of in labor force | age 30-34, the demographic groups most similar to Bangladeshis are Arab (84.3%, a difference of 0.010%), Jamaican (84.3%, a difference of 0.010%), Indonesian (84.3%, a difference of 0.010%), Japanese (84.3%, a difference of 0.010%), and Lebanese (84.4%, a difference of 0.020%).
| Demographics | Rating | Rank | In Labor Force | Age 30-34 |
| Sub-Saharan Africans | 19.0 /100 | #200 | Poor 84.5% |
| Trinidadians and Tobagonians | 18.2 /100 | #201 | Poor 84.5% |
| Immigrants | West Indies | 18.1 /100 | #202 | Poor 84.5% |
| Canadians | 15.4 /100 | #203 | Poor 84.4% |
| Ecuadorians | 14.2 /100 | #204 | Poor 84.4% |
| French | 13.8 /100 | #205 | Poor 84.4% |
| Lebanese | 10.6 /100 | #206 | Poor 84.4% |
| Bangladeshis | 9.4 /100 | #207 | Tragic 84.3% |
| Arabs | 8.9 /100 | #208 | Tragic 84.3% |
| Jamaicans | 8.8 /100 | #209 | Tragic 84.3% |
| Indonesians | 8.8 /100 | #210 | Tragic 84.3% |
| Japanese | 8.8 /100 | #211 | Tragic 84.3% |
| Immigrants | Western Asia | 8.2 /100 | #212 | Tragic 84.3% |
| Immigrants | Jamaica | 7.9 /100 | #213 | Tragic 84.3% |
| Immigrants | Germany | 7.2 /100 | #214 | Tragic 84.3% |