Immigrants from Senegal vs South American In Labor Force | Age 30-34
COMPARE
Immigrants from Senegal
South American
In Labor Force | Age 30-34
In Labor Force | Age 30-34 Comparison
Immigrants from Senegal
South Americans
84.8%
IN LABOR FORCE | AGE 30-34
74.0/ 100
METRIC RATING
151st/ 347
METRIC RANK
84.7%
IN LABOR FORCE | AGE 30-34
58.7/ 100
METRIC RATING
162nd/ 347
METRIC RANK
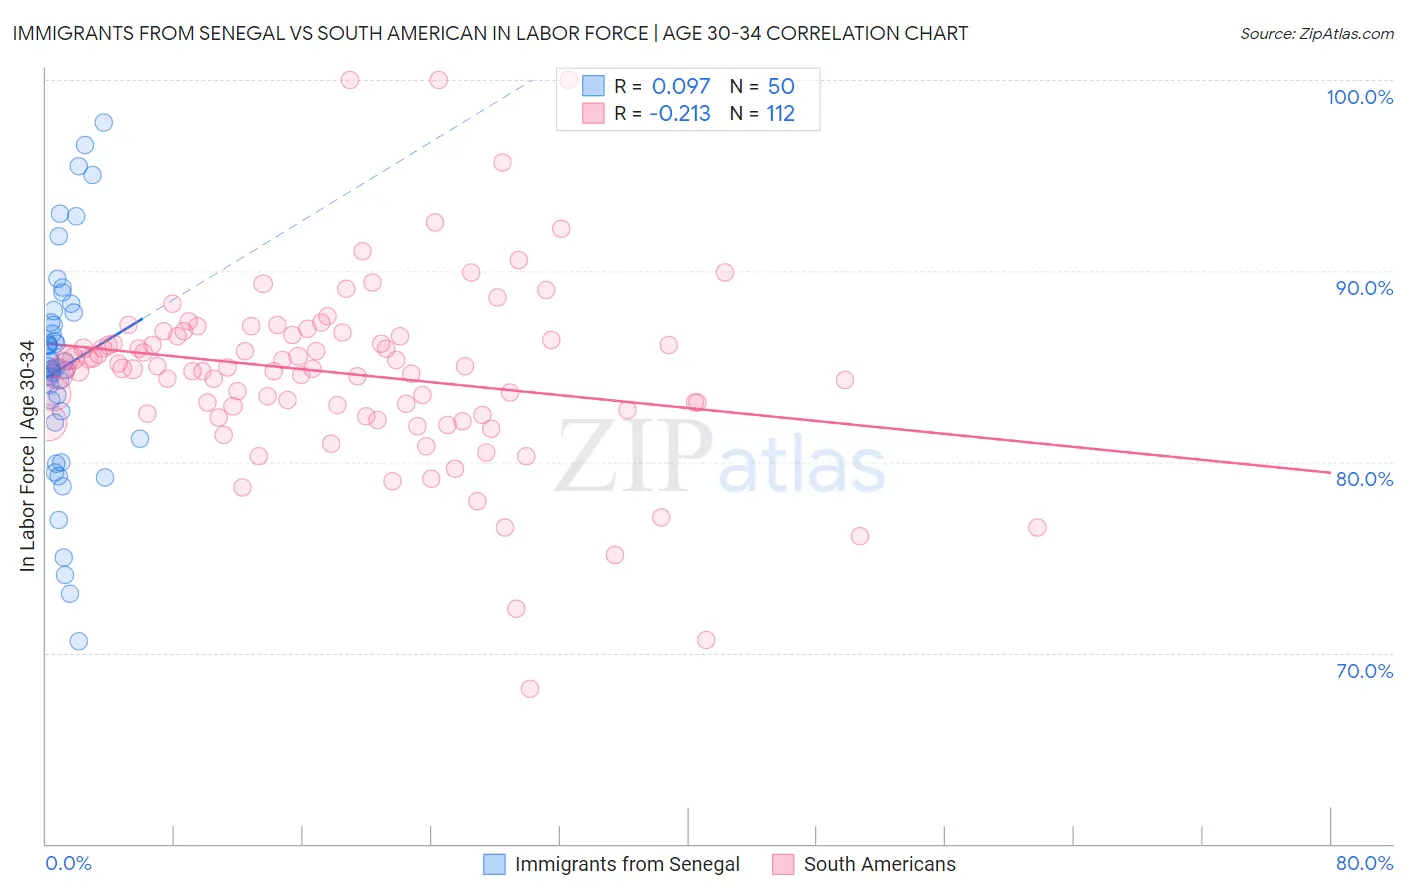
Immigrants from Senegal vs South American In Labor Force | Age 30-34 Correlation Chart
The statistical analysis conducted on geographies consisting of 90,111,000 people shows a slight positive correlation between the proportion of Immigrants from Senegal and labor force participation rate among population between the ages 30 and 34 in the United States with a correlation coefficient (R) of 0.097 and weighted average of 84.8%. Similarly, the statistical analysis conducted on geographies consisting of 493,657,533 people shows a weak negative correlation between the proportion of South Americans and labor force participation rate among population between the ages 30 and 34 in the United States with a correlation coefficient (R) of -0.213 and weighted average of 84.7%, a difference of 0.12%.
In Labor Force | Age 30-34 Correlation Summary
| Measurement | Immigrants from Senegal | South American |
| Minimum | 70.6% | 68.1% |
| Maximum | 97.8% | 100.0% |
| Range | 27.2% | 31.9% |
| Mean | 84.9% | 84.6% |
| Median | 84.9% | 84.9% |
| Interquartile 25% (IQ1) | 82.1% | 82.5% |
| Interquartile 75% (IQ3) | 87.8% | 86.6% |
| Interquartile Range (IQR) | 5.7% | 4.1% |
| Standard Deviation (Sample) | 5.8% | 4.9% |
| Standard Deviation (Population) | 5.7% | 4.8% |
Demographics Similar to Immigrants from Senegal and South Americans by In Labor Force | Age 30-34
In terms of in labor force | age 30-34, the demographic groups most similar to Immigrants from Senegal are Romanian (84.8%, a difference of 0.0%), Immigrants from Ukraine (84.8%, a difference of 0.010%), German (84.8%, a difference of 0.010%), Immigrants from Saudi Arabia (84.9%, a difference of 0.020%), and Immigrants from Colombia (84.9%, a difference of 0.020%). Similarly, the demographic groups most similar to South Americans are Immigrants from Cambodia (84.7%, a difference of 0.010%), Immigrants from Uruguay (84.7%, a difference of 0.010%), Icelander (84.7%, a difference of 0.010%), Immigrants from Western Europe (84.7%, a difference of 0.010%), and Pakistani (84.7%, a difference of 0.020%).
| Demographics | Rating | Rank | In Labor Force | Age 30-34 |
| Immigrants | Saudi Arabia | 76.6 /100 | #146 | Good 84.9% |
| Immigrants | Colombia | 76.3 /100 | #147 | Good 84.9% |
| Immigrants | Pakistan | 76.2 /100 | #148 | Good 84.9% |
| Immigrants | Ukraine | 75.1 /100 | #149 | Good 84.8% |
| Germans | 75.1 /100 | #150 | Good 84.8% |
| Immigrants | Senegal | 74.0 /100 | #151 | Good 84.8% |
| Romanians | 73.5 /100 | #152 | Good 84.8% |
| Syrians | 70.1 /100 | #153 | Good 84.8% |
| Northern Europeans | 70.0 /100 | #154 | Good 84.8% |
| Immigrants | Sudan | 69.5 /100 | #155 | Good 84.8% |
| French Canadians | 67.3 /100 | #156 | Good 84.8% |
| Peruvians | 65.9 /100 | #157 | Good 84.8% |
| Immigrants | Armenia | 64.7 /100 | #158 | Good 84.8% |
| Czechoslovakians | 63.0 /100 | #159 | Good 84.8% |
| Pakistanis | 60.8 /100 | #160 | Good 84.7% |
| Immigrants | Cambodia | 60.7 /100 | #161 | Good 84.7% |
| South Americans | 58.7 /100 | #162 | Average 84.7% |
| Immigrants | Uruguay | 57.4 /100 | #163 | Average 84.7% |
| Icelanders | 56.8 /100 | #164 | Average 84.7% |
| Immigrants | Western Europe | 56.7 /100 | #165 | Average 84.7% |
| Afghans | 55.2 /100 | #166 | Average 84.7% |