Cambodian vs Choctaw In Labor Force | Age 20-64
COMPARE
Cambodian
Choctaw
In Labor Force | Age 20-64
In Labor Force | Age 20-64 Comparison
Cambodians
Choctaw
81.1%
IN LABOR FORCE | AGE 20-64
100.0/ 100
METRIC RATING
14th/ 347
METRIC RANK
75.4%
IN LABOR FORCE | AGE 20-64
0.0/ 100
METRIC RATING
324th/ 347
METRIC RANK
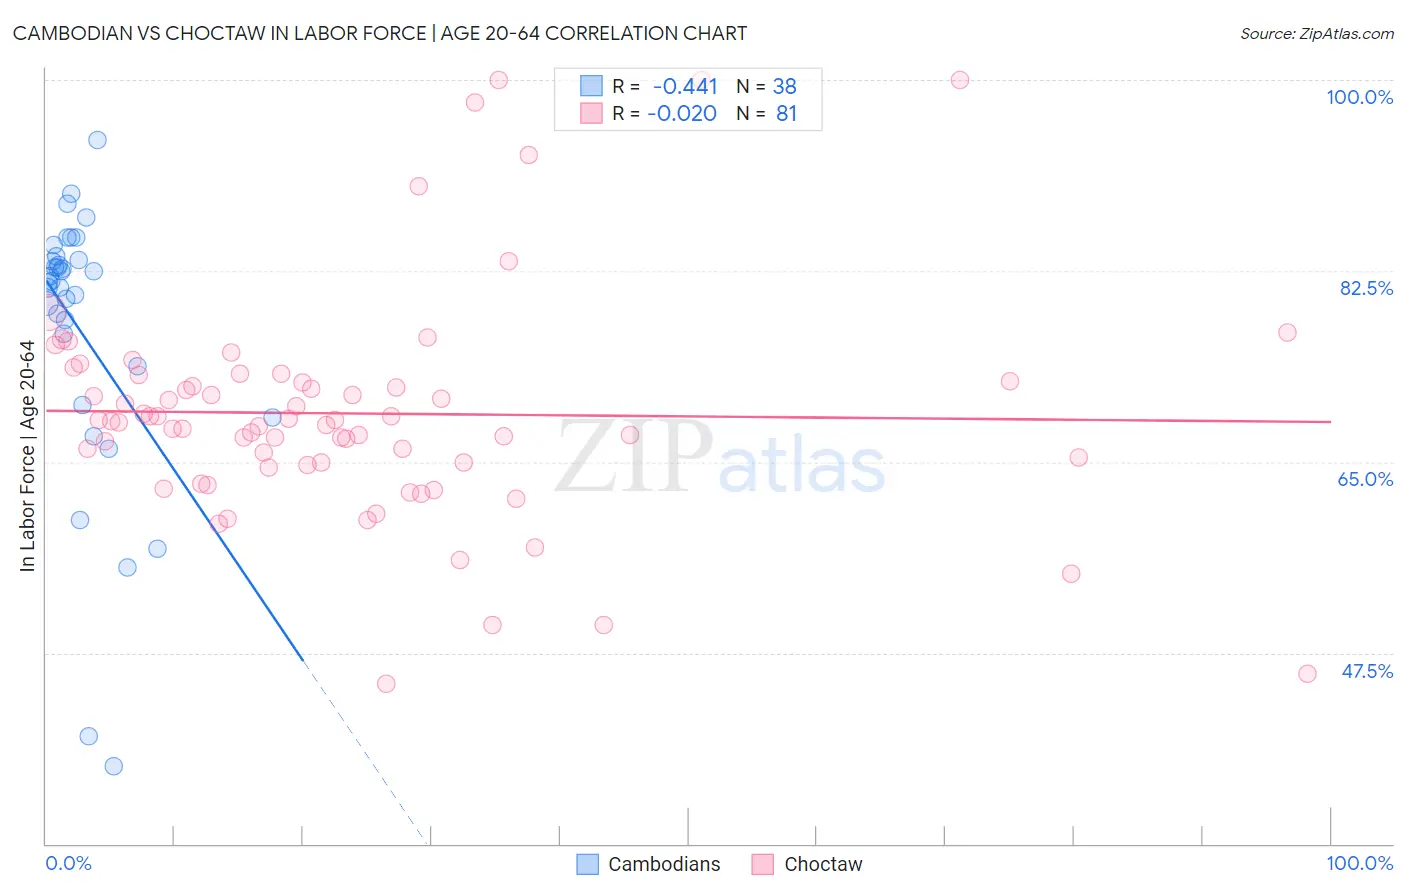
Cambodian vs Choctaw In Labor Force | Age 20-64 Correlation Chart
The statistical analysis conducted on geographies consisting of 102,521,417 people shows a moderate negative correlation between the proportion of Cambodians and labor force participation rate among population between the ages 20 and 64 in the United States with a correlation coefficient (R) of -0.441 and weighted average of 81.1%. Similarly, the statistical analysis conducted on geographies consisting of 269,719,618 people shows no correlation between the proportion of Choctaw and labor force participation rate among population between the ages 20 and 64 in the United States with a correlation coefficient (R) of -0.020 and weighted average of 75.4%, a difference of 7.5%.
In Labor Force | Age 20-64 Correlation Summary
| Measurement | Cambodian | Choctaw |
| Minimum | 37.1% | 44.7% |
| Maximum | 94.5% | 100.0% |
| Range | 57.4% | 55.3% |
| Mean | 77.0% | 69.4% |
| Median | 81.5% | 68.7% |
| Interquartile 25% (IQ1) | 73.8% | 64.8% |
| Interquartile 75% (IQ3) | 83.6% | 72.7% |
| Interquartile Range (IQR) | 9.8% | 7.9% |
| Standard Deviation (Sample) | 12.6% | 10.4% |
| Standard Deviation (Population) | 12.5% | 10.4% |
Similar Demographics by In Labor Force | Age 20-64
Demographics Similar to Cambodians by In Labor Force | Age 20-64
In terms of in labor force | age 20-64, the demographic groups most similar to Cambodians are Bulgarian (81.1%, a difference of 0.010%), Immigrants from Nepal (81.1%, a difference of 0.020%), Norwegian (81.0%, a difference of 0.12%), Immigrants from Bulgaria (81.0%, a difference of 0.13%), and Zimbabwean (81.0%, a difference of 0.14%).
| Demographics | Rating | Rank | In Labor Force | Age 20-64 |
| Immigrants | Cameroon | 100.0 /100 | #7 | Exceptional 81.6% |
| Immigrants | Somalia | 100.0 /100 | #8 | Exceptional 81.6% |
| Sierra Leoneans | 100.0 /100 | #9 | Exceptional 81.5% |
| Immigrants | Sierra Leone | 100.0 /100 | #10 | Exceptional 81.5% |
| Immigrants | Eastern Africa | 100.0 /100 | #11 | Exceptional 81.3% |
| Immigrants | Eritrea | 100.0 /100 | #12 | Exceptional 81.3% |
| Immigrants | India | 100.0 /100 | #13 | Exceptional 81.3% |
| Cambodians | 100.0 /100 | #14 | Exceptional 81.1% |
| Bulgarians | 100.0 /100 | #15 | Exceptional 81.1% |
| Immigrants | Nepal | 100.0 /100 | #16 | Exceptional 81.1% |
| Norwegians | 100.0 /100 | #17 | Exceptional 81.0% |
| Immigrants | Bulgaria | 100.0 /100 | #18 | Exceptional 81.0% |
| Zimbabweans | 100.0 /100 | #19 | Exceptional 81.0% |
| Thais | 100.0 /100 | #20 | Exceptional 80.9% |
| Liberians | 100.0 /100 | #21 | Exceptional 80.9% |
Demographics Similar to Choctaw by In Labor Force | Age 20-64
In terms of in labor force | age 20-64, the demographic groups most similar to Choctaw are Cajun (75.5%, a difference of 0.060%), Dutch West Indian (75.5%, a difference of 0.10%), Seminole (75.5%, a difference of 0.14%), Menominee (75.3%, a difference of 0.14%), and Creek (75.1%, a difference of 0.36%).
| Demographics | Rating | Rank | In Labor Force | Age 20-64 |
| Cherokee | 0.0 /100 | #317 | Tragic 76.2% |
| Chickasaw | 0.0 /100 | #318 | Tragic 76.2% |
| Inupiat | 0.0 /100 | #319 | Tragic 76.1% |
| Yakama | 0.0 /100 | #320 | Tragic 75.8% |
| Seminole | 0.0 /100 | #321 | Tragic 75.5% |
| Dutch West Indians | 0.0 /100 | #322 | Tragic 75.5% |
| Cajuns | 0.0 /100 | #323 | Tragic 75.5% |
| Choctaw | 0.0 /100 | #324 | Tragic 75.4% |
| Menominee | 0.0 /100 | #325 | Tragic 75.3% |
| Creek | 0.0 /100 | #326 | Tragic 75.1% |
| Sioux | 0.0 /100 | #327 | Tragic 75.0% |
| Kiowa | 0.0 /100 | #328 | Tragic 75.0% |
| Cheyenne | 0.0 /100 | #329 | Tragic 74.8% |
| Colville | 0.0 /100 | #330 | Tragic 74.8% |
| Paiute | 0.0 /100 | #331 | Tragic 74.7% |