Immigrants from Dominica vs Choctaw In Labor Force | Age 20-64
COMPARE
Immigrants from Dominica
Choctaw
In Labor Force | Age 20-64
In Labor Force | Age 20-64 Comparison
Immigrants from Dominica
Choctaw
78.1%
IN LABOR FORCE | AGE 20-64
0.0/ 100
METRIC RATING
280th/ 347
METRIC RANK
75.4%
IN LABOR FORCE | AGE 20-64
0.0/ 100
METRIC RATING
324th/ 347
METRIC RANK
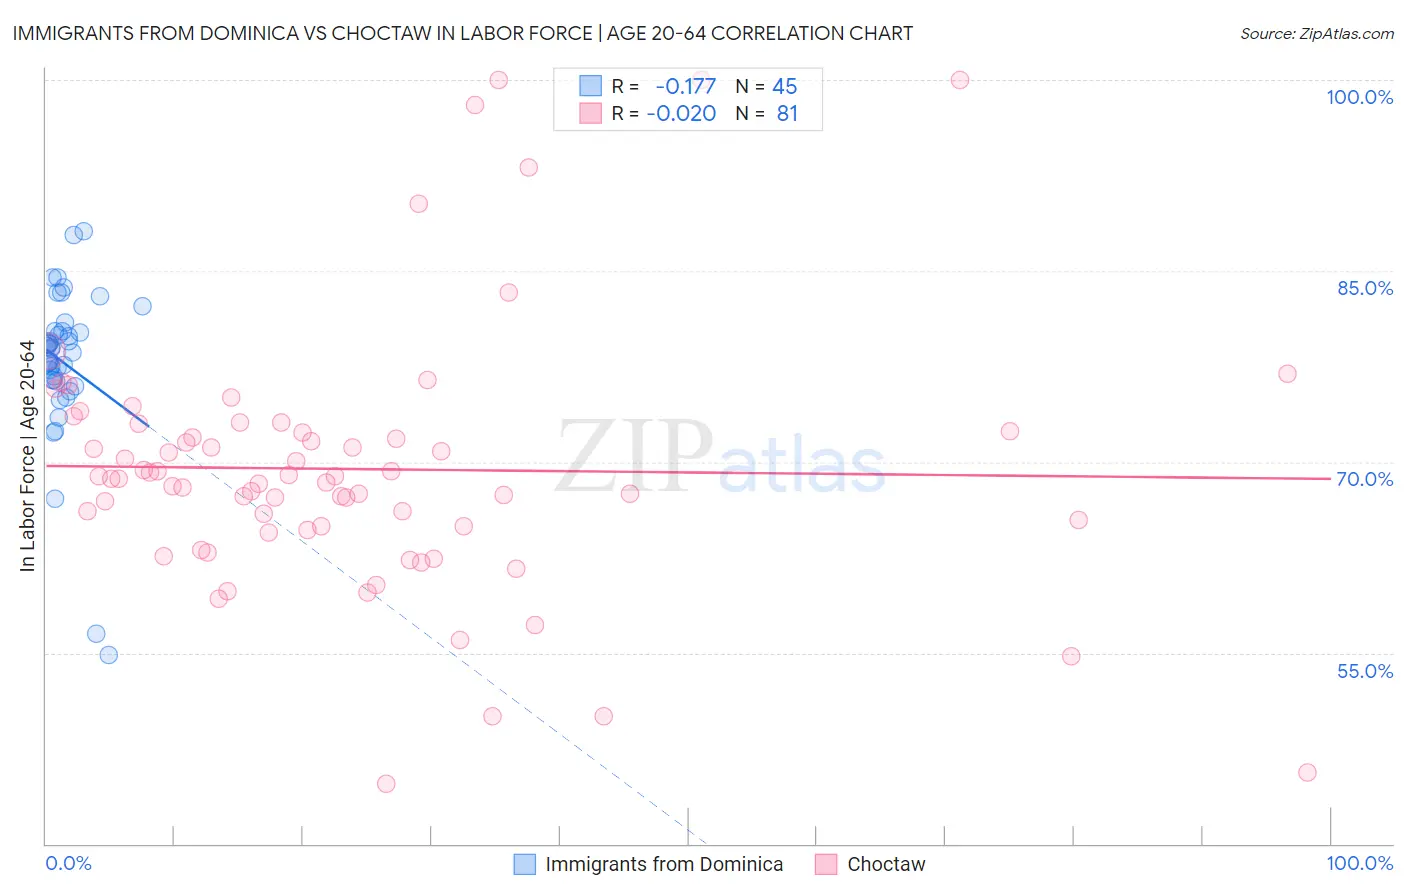
Immigrants from Dominica vs Choctaw In Labor Force | Age 20-64 Correlation Chart
The statistical analysis conducted on geographies consisting of 83,787,194 people shows a poor negative correlation between the proportion of Immigrants from Dominica and labor force participation rate among population between the ages 20 and 64 in the United States with a correlation coefficient (R) of -0.177 and weighted average of 78.1%. Similarly, the statistical analysis conducted on geographies consisting of 269,719,618 people shows no correlation between the proportion of Choctaw and labor force participation rate among population between the ages 20 and 64 in the United States with a correlation coefficient (R) of -0.020 and weighted average of 75.4%, a difference of 3.6%.
In Labor Force | Age 20-64 Correlation Summary
| Measurement | Immigrants from Dominica | Choctaw |
| Minimum | 54.8% | 44.7% |
| Maximum | 88.1% | 100.0% |
| Range | 33.3% | 55.3% |
| Mean | 77.8% | 69.4% |
| Median | 78.9% | 68.7% |
| Interquartile 25% (IQ1) | 76.4% | 64.8% |
| Interquartile 75% (IQ3) | 80.3% | 72.7% |
| Interquartile Range (IQR) | 3.9% | 7.9% |
| Standard Deviation (Sample) | 6.2% | 10.4% |
| Standard Deviation (Population) | 6.1% | 10.4% |
Similar Demographics by In Labor Force | Age 20-64
Demographics Similar to Immigrants from Dominica by In Labor Force | Age 20-64
In terms of in labor force | age 20-64, the demographic groups most similar to Immigrants from Dominica are Guyanese (78.1%, a difference of 0.030%), Belizean (78.2%, a difference of 0.040%), Immigrants from St. Vincent and the Grenadines (78.1%, a difference of 0.050%), Nonimmigrants (78.1%, a difference of 0.060%), and Immigrants from Guyana (78.1%, a difference of 0.080%).
| Demographics | Rating | Rank | In Labor Force | Age 20-64 |
| French American Indians | 0.0 /100 | #273 | Tragic 78.2% |
| Aleuts | 0.0 /100 | #274 | Tragic 78.2% |
| Spanish | 0.0 /100 | #275 | Tragic 78.2% |
| Puget Sound Salish | 0.0 /100 | #276 | Tragic 78.2% |
| Immigrants | Bahamas | 0.0 /100 | #277 | Tragic 78.2% |
| Mexican American Indians | 0.0 /100 | #278 | Tragic 78.2% |
| Belizeans | 0.0 /100 | #279 | Tragic 78.2% |
| Immigrants | Dominica | 0.0 /100 | #280 | Tragic 78.1% |
| Guyanese | 0.0 /100 | #281 | Tragic 78.1% |
| Immigrants | St. Vincent and the Grenadines | 0.0 /100 | #282 | Tragic 78.1% |
| Immigrants | Nonimmigrants | 0.0 /100 | #283 | Tragic 78.1% |
| Immigrants | Guyana | 0.0 /100 | #284 | Tragic 78.1% |
| Osage | 0.0 /100 | #285 | Tragic 78.0% |
| Immigrants | Belize | 0.0 /100 | #286 | Tragic 78.0% |
| Vietnamese | 0.0 /100 | #287 | Tragic 78.0% |
Demographics Similar to Choctaw by In Labor Force | Age 20-64
In terms of in labor force | age 20-64, the demographic groups most similar to Choctaw are Cajun (75.5%, a difference of 0.060%), Dutch West Indian (75.5%, a difference of 0.10%), Seminole (75.5%, a difference of 0.14%), Menominee (75.3%, a difference of 0.14%), and Creek (75.1%, a difference of 0.36%).
| Demographics | Rating | Rank | In Labor Force | Age 20-64 |
| Cherokee | 0.0 /100 | #317 | Tragic 76.2% |
| Chickasaw | 0.0 /100 | #318 | Tragic 76.2% |
| Inupiat | 0.0 /100 | #319 | Tragic 76.1% |
| Yakama | 0.0 /100 | #320 | Tragic 75.8% |
| Seminole | 0.0 /100 | #321 | Tragic 75.5% |
| Dutch West Indians | 0.0 /100 | #322 | Tragic 75.5% |
| Cajuns | 0.0 /100 | #323 | Tragic 75.5% |
| Choctaw | 0.0 /100 | #324 | Tragic 75.4% |
| Menominee | 0.0 /100 | #325 | Tragic 75.3% |
| Creek | 0.0 /100 | #326 | Tragic 75.1% |
| Sioux | 0.0 /100 | #327 | Tragic 75.0% |
| Kiowa | 0.0 /100 | #328 | Tragic 75.0% |
| Cheyenne | 0.0 /100 | #329 | Tragic 74.8% |
| Colville | 0.0 /100 | #330 | Tragic 74.8% |
| Paiute | 0.0 /100 | #331 | Tragic 74.7% |