Immigrants from Belgium vs Bolivian In Labor Force | Age 20-64
COMPARE
Immigrants from Belgium
Bolivian
In Labor Force | Age 20-64
In Labor Force | Age 20-64 Comparison
Immigrants from Belgium
Bolivians
79.6%
IN LABOR FORCE | AGE 20-64
53.1/ 100
METRIC RATING
172nd/ 347
METRIC RANK
81.7%
IN LABOR FORCE | AGE 20-64
100.0/ 100
METRIC RATING
5th/ 347
METRIC RANK
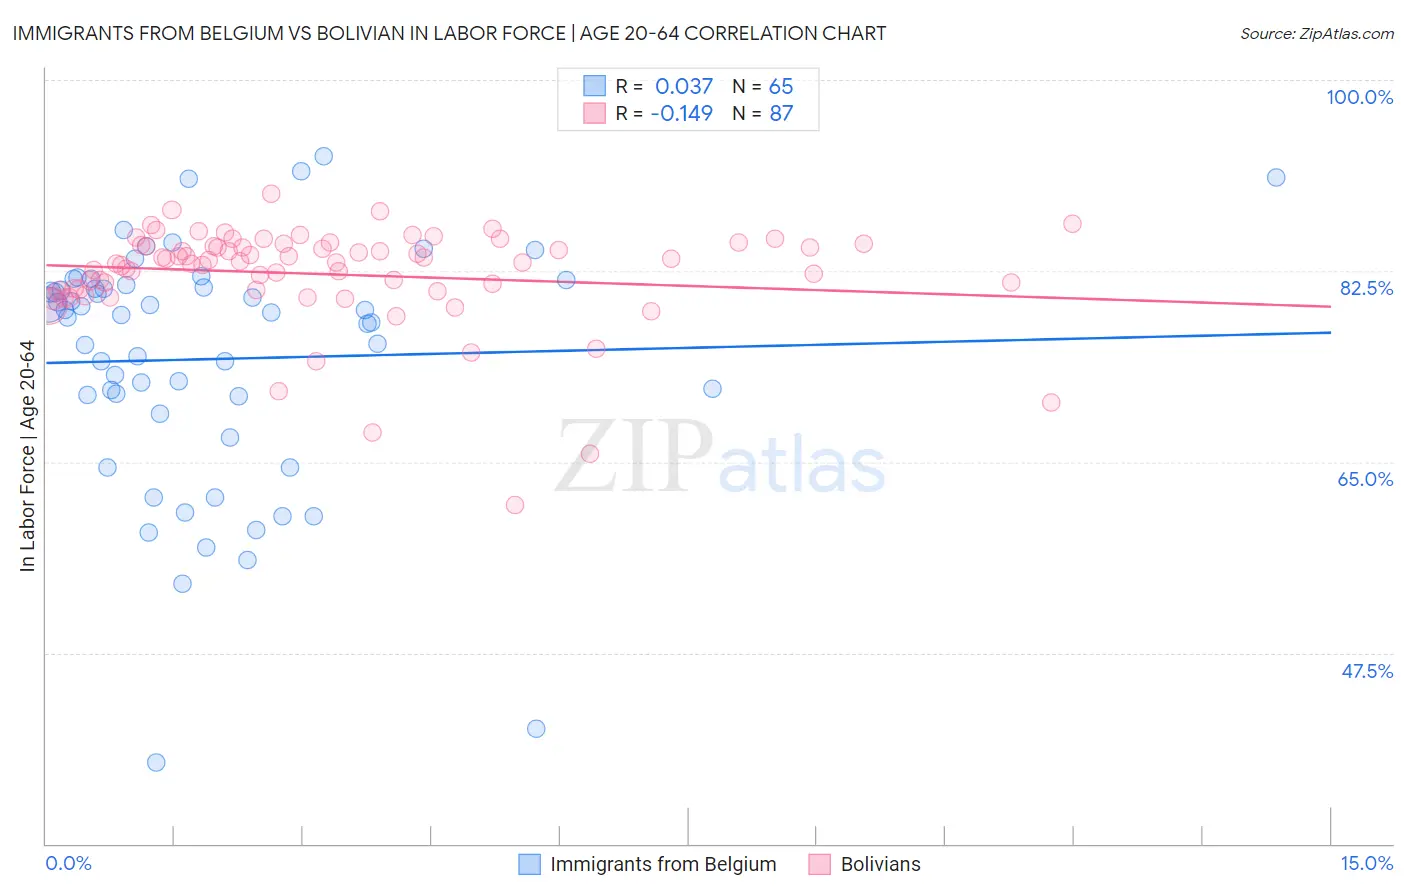
Immigrants from Belgium vs Bolivian In Labor Force | Age 20-64 Correlation Chart
The statistical analysis conducted on geographies consisting of 146,728,908 people shows no correlation between the proportion of Immigrants from Belgium and labor force participation rate among population between the ages 20 and 64 in the United States with a correlation coefficient (R) of 0.037 and weighted average of 79.6%. Similarly, the statistical analysis conducted on geographies consisting of 184,684,128 people shows a poor negative correlation between the proportion of Bolivians and labor force participation rate among population between the ages 20 and 64 in the United States with a correlation coefficient (R) of -0.149 and weighted average of 81.7%, a difference of 2.6%.
In Labor Force | Age 20-64 Correlation Summary
| Measurement | Immigrants from Belgium | Bolivian |
| Minimum | 37.4% | 61.1% |
| Maximum | 93.0% | 89.6% |
| Range | 55.6% | 28.5% |
| Mean | 74.4% | 82.2% |
| Median | 78.5% | 83.4% |
| Interquartile 25% (IQ1) | 70.2% | 80.8% |
| Interquartile 75% (IQ3) | 81.1% | 84.9% |
| Interquartile Range (IQR) | 10.9% | 4.1% |
| Standard Deviation (Sample) | 11.2% | 4.7% |
| Standard Deviation (Population) | 11.1% | 4.7% |
Similar Demographics by In Labor Force | Age 20-64
Demographics Similar to Immigrants from Belgium by In Labor Force | Age 20-64
In terms of in labor force | age 20-64, the demographic groups most similar to Immigrants from Belgium are Immigrants from Switzerland (79.6%, a difference of 0.0%), Slavic (79.6%, a difference of 0.010%), Immigrants from Scotland (79.6%, a difference of 0.010%), Syrian (79.6%, a difference of 0.030%), and Laotian (79.6%, a difference of 0.040%).
| Demographics | Rating | Rank | In Labor Force | Age 20-64 |
| Nigerians | 64.0 /100 | #165 | Good 79.7% |
| Okinawans | 62.7 /100 | #166 | Good 79.6% |
| Immigrants | Iraq | 62.0 /100 | #167 | Good 79.6% |
| Immigrants | Indonesia | 61.8 /100 | #168 | Good 79.6% |
| Laotians | 58.4 /100 | #169 | Average 79.6% |
| Slavs | 54.0 /100 | #170 | Average 79.6% |
| Immigrants | Switzerland | 53.3 /100 | #171 | Average 79.6% |
| Immigrants | Belgium | 53.1 /100 | #172 | Average 79.6% |
| Immigrants | Scotland | 52.4 /100 | #173 | Average 79.6% |
| Syrians | 50.0 /100 | #174 | Average 79.6% |
| Cubans | 46.1 /100 | #175 | Average 79.5% |
| Australians | 46.0 /100 | #176 | Average 79.5% |
| Immigrants | Netherlands | 45.2 /100 | #177 | Average 79.5% |
| Czechoslovakians | 44.3 /100 | #178 | Average 79.5% |
| Armenians | 41.4 /100 | #179 | Average 79.5% |
Demographics Similar to Bolivians by In Labor Force | Age 20-64
In terms of in labor force | age 20-64, the demographic groups most similar to Bolivians are Somali (81.6%, a difference of 0.11%), Immigrants from Cameroon (81.6%, a difference of 0.15%), Immigrants from Somalia (81.6%, a difference of 0.17%), Sierra Leonean (81.5%, a difference of 0.17%), and Luxembourger (81.9%, a difference of 0.20%).
| Demographics | Rating | Rank | In Labor Force | Age 20-64 |
| Immigrants | Ethiopia | 100.0 /100 | #1 | Exceptional 82.1% |
| Ethiopians | 100.0 /100 | #2 | Exceptional 82.0% |
| Immigrants | Bolivia | 100.0 /100 | #3 | Exceptional 81.9% |
| Luxembourgers | 100.0 /100 | #4 | Exceptional 81.9% |
| Bolivians | 100.0 /100 | #5 | Exceptional 81.7% |
| Somalis | 100.0 /100 | #6 | Exceptional 81.6% |
| Immigrants | Cameroon | 100.0 /100 | #7 | Exceptional 81.6% |
| Immigrants | Somalia | 100.0 /100 | #8 | Exceptional 81.6% |
| Sierra Leoneans | 100.0 /100 | #9 | Exceptional 81.5% |
| Immigrants | Sierra Leone | 100.0 /100 | #10 | Exceptional 81.5% |
| Immigrants | Eastern Africa | 100.0 /100 | #11 | Exceptional 81.3% |
| Immigrants | Eritrea | 100.0 /100 | #12 | Exceptional 81.3% |
| Immigrants | India | 100.0 /100 | #13 | Exceptional 81.3% |
| Cambodians | 100.0 /100 | #14 | Exceptional 81.1% |
| Bulgarians | 100.0 /100 | #15 | Exceptional 81.1% |